
Study design
The study incorporated a double blind, 2-condition, randomized, crossover design performed on two testing days at Texas Tech University, Lubbock, TX. On the first test day, participants were randomly assigned to receive either the high-protein (HP) meal or the standard-protein (SP) meal in a 1:1 ratio. On the second test day, each participant received the alternate meal (i.e., those who first received HP were given SP, and vice versa), ensuring that all participants consumed both meals in a randomized order. The randomization sequence was generated by two non–study team members who were not involved in data collection or outcome assessment using randomization.com. The participants and outcome assessors were blinded to the randomization. Participants were not told which instant ramen noodle they were receiving on the test days. Three to thirty-five days separated the two meal conditions.
The protocol was approved by the Institutional Review Board at Texas Tech University. All participants provided their informed consent and were free to withdraw from the study at any time.
Participants
The participants were 25 generally healthy men and women between the ages of 25 and 45, with BMI between 20 and 30 kg/m2. Participants were recruited from the Lubbock, Texas, area using Texas Tech University Listserv (Tech Announce). Flyers were posted on campus and in the Lubbock community.
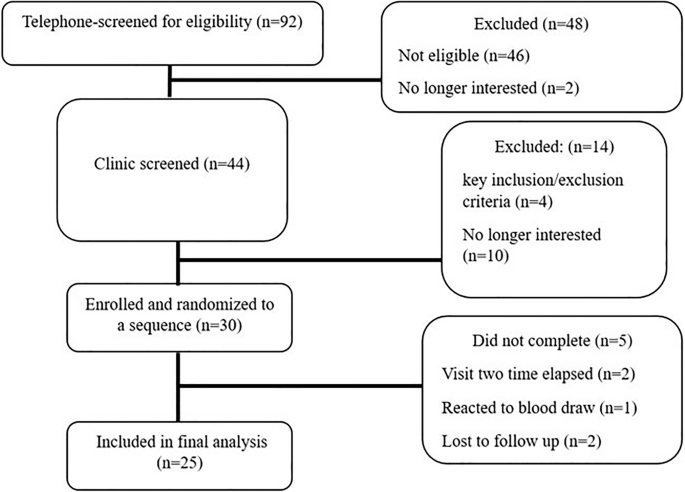
Men and women aged 25–45 years with body mass index (BMI; kg/m2], 20–30) were eligible for the study. Exclusion criteria included body weight <110 pounds, diabetes of any type, fasting capillary glucose ≥100 mg/dL, unstable systemic medical condition, >10% change in body weight in the prior 3 months, taking medications that affect appetite or glucose regulation, prior bariatric surgery, unmedicated blood pressure >130/90 mmHg, intolerance, dislike or allergy to the study foods, tobacco use within 6 months, consumption of >14 alcoholic drinks/week, following a weight loss diet during the study recruitment period, irregular menstrual cycle, pregnant or lactating, and being unwilling or unable to have an IV catheter inserted. The flow diagram of participant screening and enrollment is shown in Fig. 1.
Fig. 1: Consolidated standards of reporting trials (CONSORT diagram).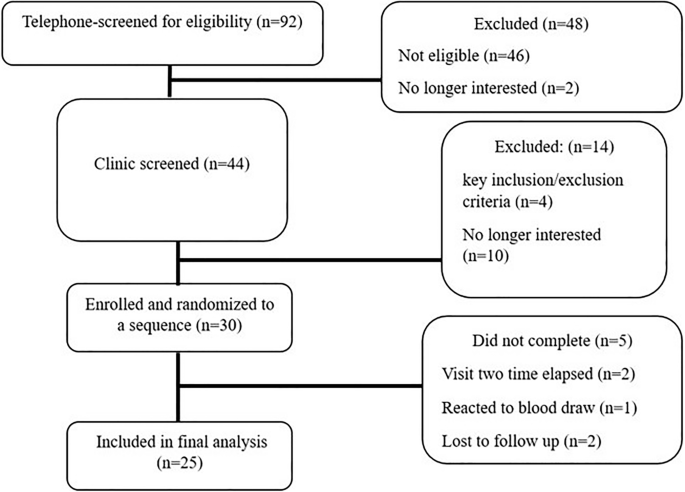
Showing participant flow through the study, including enrollment, randomization, allocation, follow-up, and analysis.
Testing day
Participants were at the research facility for approximately 5 h per test day. They were asked to limit physical activity to the past 24 h; refraining from vigorous physical activity like running, as well as other vigorous physical activities in which one could only say a few words before one had to take a breath. The participants were provided with a standardized dinner to consume the day prior to testing. Following a 12 h fast (only water was allowed), participants arrived at the facility between 07:00 and 9:00, had an IV catheter inserted in a vein in the forearm, a fasting blood sample was taken, and visual analogue scale (VAS) was administered. Participants were provided with the test noodles and were asked to consume the noodles within 15 min. Water was provided at breakfast time and for the next 180 min when the participants remained in the clinic. Following completion of the meal, blood was sampled at regular intervals (30, 60, 120, and 180 min) for the assessment of hunger- and satiety hormones (i.e., Glucagon Like Peptide-1, Peptide-YY3-36, and Ghrelin), and glucose and insulin. VAS questionnaires were utilized for obtaining appetite-related responses, including hunger, satiety, fullness, prospective food consumption, the desire to eat something sweet, the desire to eat something savory, the desire to eat something fatty, and the desire to eat something salty. The primary outcome was Appetite Score (mm*180 min), which was calculated from VAS scores as satiety + fullness + (100 − hunger) + (100 − prospective food consumption)/4 [16].
Test meals and ad libitum lunch
During the HP condition, participants received one portion of wheat and pea protein based high-protein instant ramen noodles [CHEF WOO Roasted Chicken Flavor Ramen Cup Noodles, Borealis Foods; 71 g; 320 kcal; fat 14 g (39% kcal); saturated fat 1.5 g; carbohydrates 29 g (36% kcal); fiber 2 g; total sugars 3 g; protein 20 g (25% kcal)]. During the control condition, participants received a weight-matched portion of wheat protein based SP instant ramen noodles [RAMEN EXPRESS Chicken Flavor Ramen Cup Noodle Chef Woo, Borealis Foods; 71 g; 311 kcal; fat 13 g (38% kcal); saturated fat 6 g; carbohydrates 41 g (53% kcal); fiber 1 g; total sugars 2 g; protein 6 g (8% kcal)]. For both conditions, the noodles were presented to the participants in the same manner in a plain white cup. Table 1 shows the nutrient composition of instant ramen noodles breakfasts offered.
Table 1 Nutrient composition of instant ramen noodle breakfasts offered to participants.
For determining the buffet lunch intake, an ad libitum buffet of 10 commonly liked foods (mac & cheese, lasagna, fried rice, cheddar cheese dip, humus, guacamole, corn chips, potato crisps, carrots, and celery was provided (4771 kcal). Each food item in the buffet (Table 2.) was provided in pre-weighed portions. Participants were instructed to eat as much or as little as they desired. The buffet was provided in an isolated room and the use of cell phones, books, TV, and computers was not permitted during the meal to limit distractions.
Table 2 Buffet Lunch offered: Amount and Macronutrient composition.
The participants were told that the purpose of the study was to help us learn if HP instant ramen noodles increased satiety, reduced hunger, and improved blood sugar levels compared to regular SP instant ramen noodles. Food intake was determined covertly by carefully measuring the pre-meal weight of each buffet item minus the post weight. Plate waste was also measured. Energy intake was calculated based on the nutrition facts information of the buffet items.
Statistical analysis
Statistical model assumptions were evaluated and confirmed prior to analyses for hypothesis testing. For non-normal response variables, rank-transformed values were computed to obtain normally distributed data. The mixed model procedure was used to examine the effect of study condition (HP vs. SP instant ramen noodles) on each outcome. The model included effects of participant, time, condition, randomization sequence, and gender (participant was included as a random effect). Randomization sequence, condition, visit, and time were modeled as fixed effects. In addition, sex was modeled as a fixed effect to examine differences in response by sex. AUC over 180 min was calculated using the trapezoidal rule. A paired t-test was used to examine between-condition differences in the buffet lunch intake. P < 0.05 was considered as statistically significant.
The primary outcome was appetite score (mm*180 min). Based on prior reporting for the appetite score [17], completion of 20 participants was needed to provide 80% power to detect an 8 mm * 180 min difference in the appetite score between conditions based on the crossover design, assuming standard deviation, 11.86 mm and correlation coefficient, 0.5 at a 2-sided 5% level of significance. A total of 30 participants were enrolled in the study to account for possible attrition.
To get complete VAS data for the assessment of the primary outcome (appetite score), data analysis was performed on 25 participants who completed the trial (completers analysis).
All analyses were conducted with the Statistical Package for the Social Sciences (SPSS; version 29.0; SPSS, Chicago, IL, USA).
AloJapan.com