
 Net Margin Improvement To 5% Challenges Bearish Narratives")
Sumitomo Osaka Cement (TSE:5232) has wrapped up FY 2026 with fourth quarter revenue of ¥59.3b and basic EPS of ¥156.44, capping a year in which trailing twelve month revenue reached ¥223.7b and basic EPS came in at ¥349.58. Over recent periods the company has seen quarterly revenue move between ¥52.9b and ¥59.3b while basic EPS has ranged from ¥20.78 to ¥173.52. This gives investors a clear view of how earnings track alongside a relatively tight revenue band. With trailing net margin at 5% and earnings growth outpacing revenue growth, the latest numbers put the focus squarely on how durable these margins prove to be.
See our full analysis for Sumitomo Osaka Cement.
With the headline figures on the table, the next step is to set these results against the most common narratives around Sumitomo Osaka Cement and see which stories the numbers support and which they start to challenge.
Curious how numbers become stories that shape markets? Explore Community Narratives
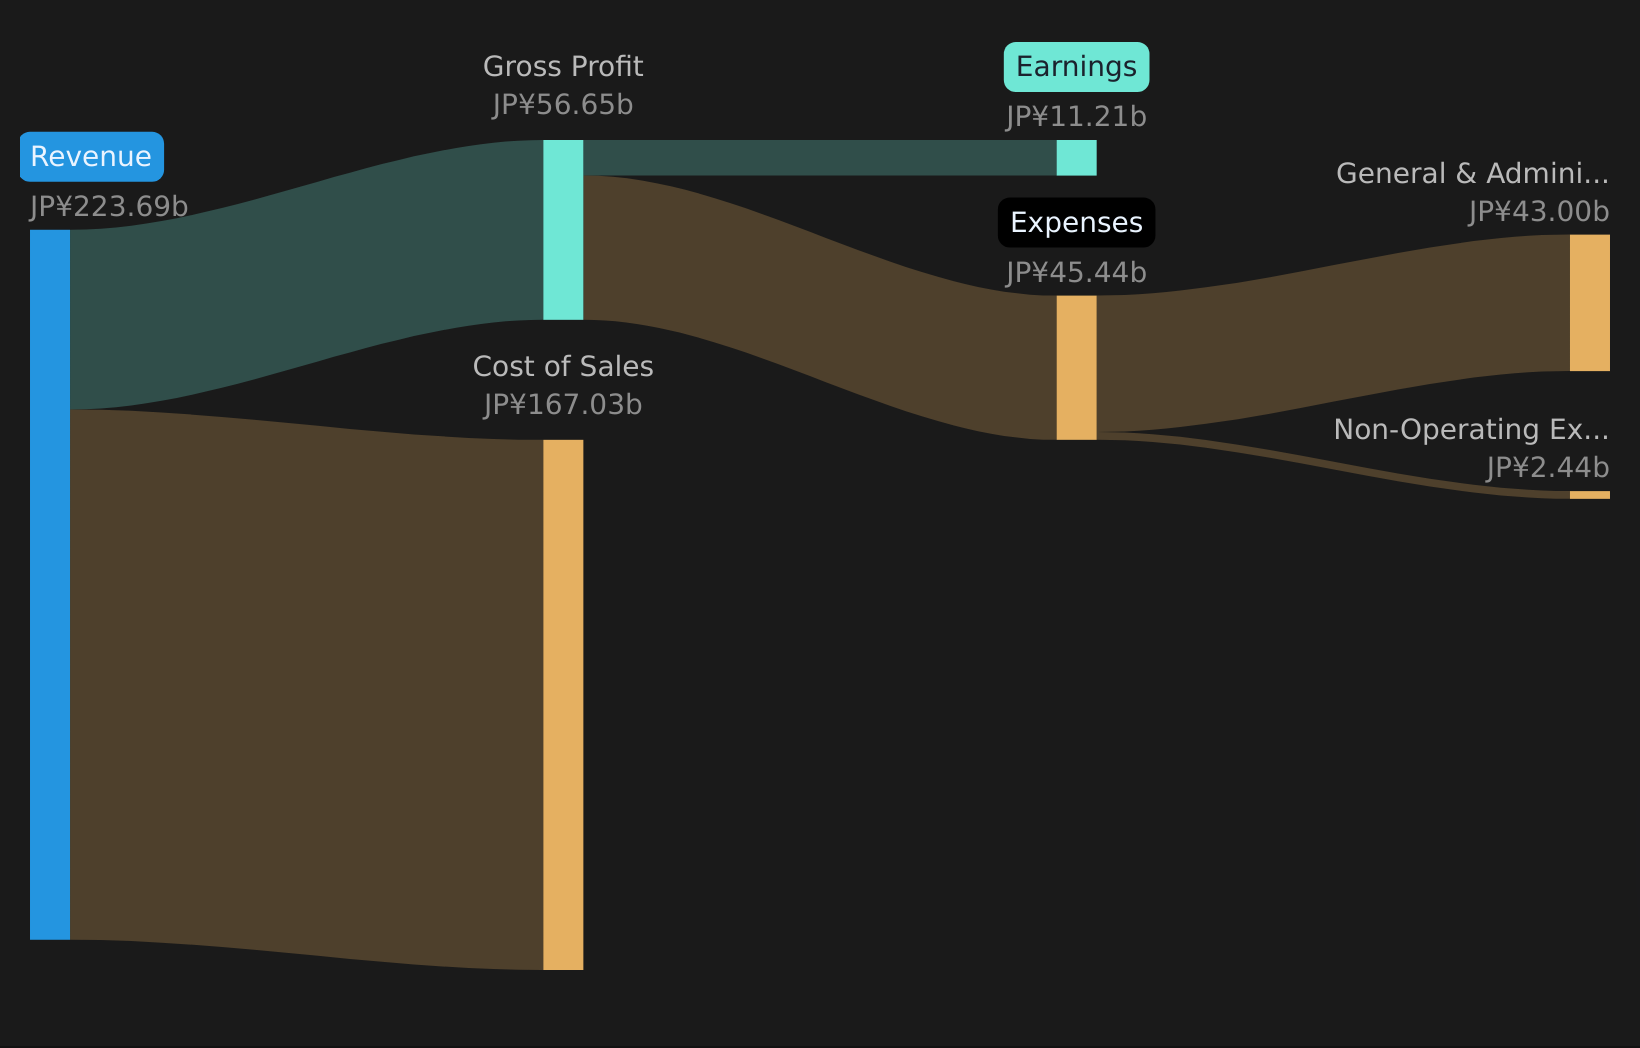 TSE:5232 Revenue & Expenses Breakdown as at May 2026 EPS Swings Around 156.44 JPY Finish Across FY 2026, basic EPS moved from ¥86.24 in Q1 to ¥128.36 in Q2, dipped to ¥20.78 in Q3, then reached ¥156.44 in Q4. Net income for those quarters came in at ¥2,795m, ¥4,110m, ¥660m, and ¥4,964m respectively. What stands out for a bullish narrative is that trailing twelve month EPS of ¥349.58 and net income of ¥11,214m sit above the single year quarterly run rate. This strongly supports the view that earnings momentum, including the reported 24.5% growth over the past year and around 6.1% per year over five years, is currently a central part of the story even though Q3 FY 2026 net income of ¥660m was much lower than the other FY 2026 quarters.
Supporters pointing to forecast annual earnings growth of about 10.8% versus a JP market forecast of 9.9% can anchor that view in the trailing net margin of 5% and the higher trailing EPS level compared with the quarterly figures. At the same time, the uneven quarterly pattern, especially between the ¥4,964m net income in Q4 and the ¥660m in Q3, gives bullish investors a reason to check how repeatable the higher profitability points really are. Margins Improve To 5% Amid Slower Revenue Trailing net margin has reached 5% compared with 4.1% a year earlier, while revenue is forecast to grow at about 3.7% per year versus a JP market forecast of 5.9%. Critics who take a bearish stance often worry about slower top line expansion. The combination of a 3.7% revenue growth forecast with a 5% trailing net margin and reported 24.5% earnings growth over the past year creates a clear tension between margin driven earnings support and more modest revenue expectations.
Bears can point out that if revenue is expected to trail the wider JP market by roughly 2.2 percentage points, the current margin level becomes more important for sustaining that reported earnings pace. On the other hand, the move from a 4.1% to 5% net margin and the higher trailing EPS of ¥349.58 relative to the recent quarterly EPS series suggest recent profitability has been supported more by margin effects than by strong revenue growth. This does not automatically align with a cautious revenue focused view. P/E Premium Versus 45.9% DCF Gap The stock trades at a P/E of 14.4x, compared with 8x for peers and 10.2x for the JP Basic Materials industry. The current share price of ¥5,101 sits about 45.9% below a DCF fair value of ¥9,436.16, and earnings are reported to have grown 24.5% over the past year. What is unusual here for investors weighing a more bullish valuation angle is that the higher P/E relative to peers and industry sits next to a DCF fair value estimate that is much higher than the share price. The premium multiple therefore coexists with an implied discount to DCF, while minor risks such as a 2.35% dividend yield that is not well covered by free cash flow and relatively higher share price volatility over the past three months give a more cautious narrative specific figures to focus on.
Supporters can argue that the reported 24.5% earnings growth and forecast earnings growth of about 10.8% annually help justify a P/E above the 8x peer level, which aligns with the idea that the stock is being priced for stronger earnings than its sector average. Those worried about the bearish points may instead highlight the weaker free cash flow coverage of the 2.35% dividend and recent volatility as reasons why, despite the approximately ¥4,335 gap between the ¥5,101 share price and the ¥9,436.16 DCF fair value, the market is keeping the multiple above peers but the price below the model estimate.
Curious how other investors are reading these margin and valuation signals compared with the raw numbers you see here? Curious how numbers become stories that shape markets? Explore Community Narratives
Next Steps
Don’t just look at this quarter; the real story is in the long-term trend. We’ve done an in-depth analysis on Sumitomo Osaka Cement’s growth and its valuation to see if today’s price is a bargain. Add the company to your watchlist or portfolio now so you don’t miss the next big move.
Seen enough to sense both optimism and concern around the stock, but not yet sure where you stand? Move quickly from headline takeaways to your own judgement and use the 3 key rewards and 2 important warning signs.
Explore Alternatives
Sumitomo Osaka Cement has a relatively high P/E ratio, uneven quarterly earnings, modest revenue growth expectations, and a dividend that is not well covered by free cash flow.
If you want stocks where income appears better supported by underlying cash generation and financial strength, check out the solid balance sheet and fundamentals stocks screener (36 results) today and compare the trade offs yourself.
This article by Simply Wall St is general in nature. We provide commentary based on historical data
and analyst forecasts only using an unbiased methodology and our articles are not intended to be financial advice. It does not constitute a recommendation to buy or sell any stock, and does not take account of your objectives, or your
financial situation. We aim to bring you long-term focused analysis driven by fundamental data.
Note that our analysis may not factor in the latest price-sensitive company announcements or qualitative material.
Simply Wall St has no position in any stocks mentioned.
New: Manage All Your Stock Portfolios in One Place
We’ve created the ultimate portfolio companion for stock investors, and it’s free.
• Connect an unlimited number of Portfolios and see your total in one currency
• Be alerted to new Warning Signs or Risks via email or mobile
• Track the Fair Value of your stocks
Try a Demo Portfolio for Free
Have feedback on this article? Concerned about the content? Get in touch with us directly. Alternatively, email editorial-team@simplywallst.com
AloJapan.com