
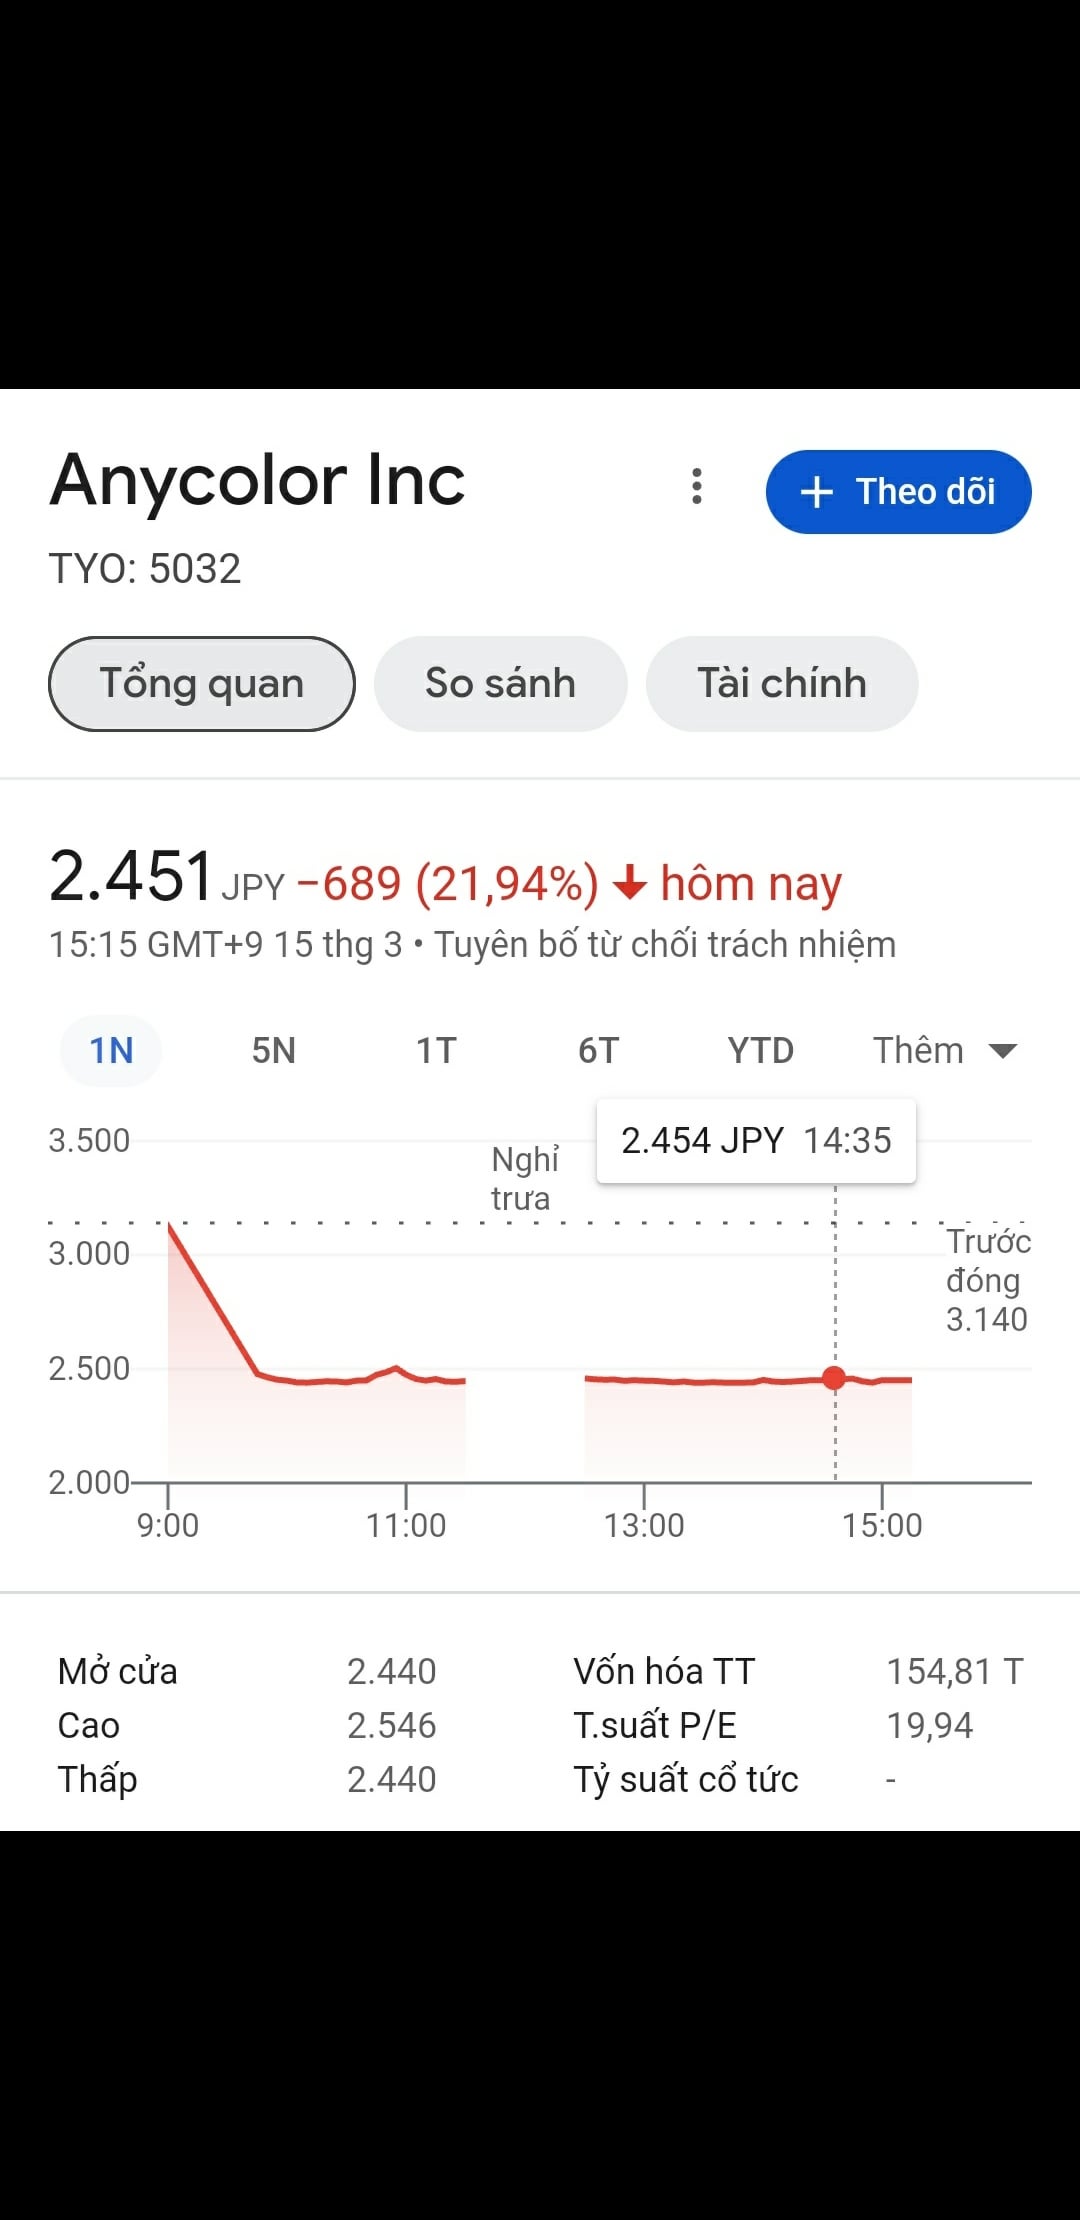
Don't mind the y axis scale, nothing to see there. And the shape of niji's plateau. Again nothing to see. And the final numbers of the dropbeing in one case a very small setback and in the other literally the max drop legally allowed. Definitely nothing to see.
by Frequent_Dig1934
20 Comments
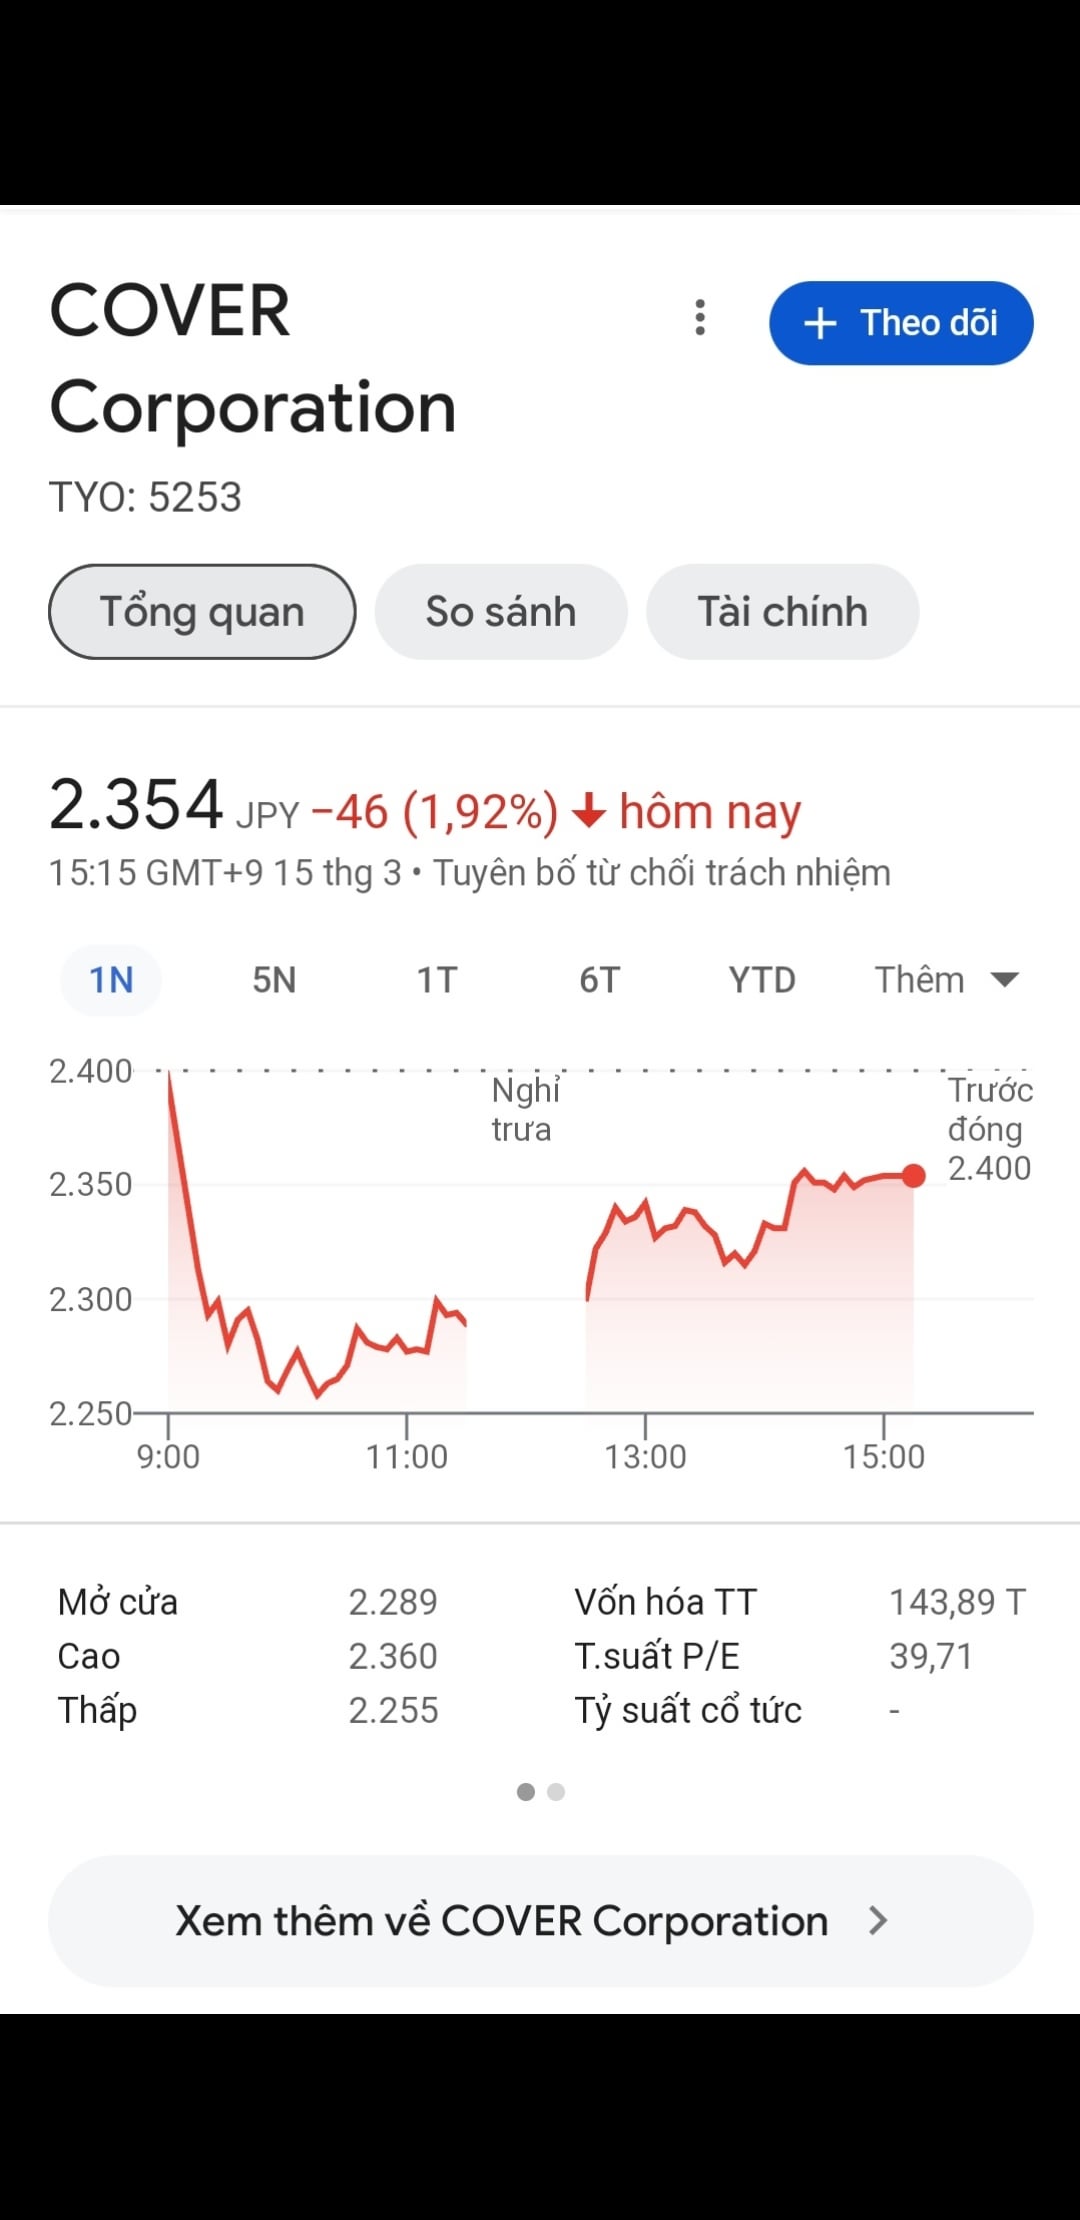
-22% vs -2%.
That’s really all you need to consider to see that Nijisanjis situation is not a result of wider market forces, unless they somehow fail to affect Cover, or one would expect +20% on Cover otherwise.
The Anycolor graph doesn’t bring much confidence anyway; to me, it looks like they had a drop and then stagnated for a while, which doesn’t look very buyable to me.
Cover on the other hand, while it has been fluctuating, it is on a steady increase back to where it was before the drop was indicated.
I know that the stock market is currently closed for the weekend, but still, my point stands.
Also, are those graphs over the course of 4 hours, instead of a couple of days?, I don’t know much about stocks but I can imagine that they lose and gain small increments of value all the time so hour-by-hour gains will show fluctuations.
Edit: Also, since it is hour by hour, the fact that Anycolor has no fluctuations is a bad sign, as that indicates to me that it is unlikely to increase since if it were just standard hour by hour fluctuations, it would have small increments of gain and loss but its completely still.
Typical parasocial behaviour from Sistas
I believe some people don’t know how to read a graph.
[deleted]
Right, losing & staying 700円 down is very different from initially dropping 150円 from an industry wipe drop then recovering about 100円.
Furthermore, across a 1 year period, Cover gained 68%. The same cannot be said for Anycolor.
It is not even close to identical
What do you mean, hitting as close to the lowest value you can possibly go and decreasing in value by 2% are literally identical.
Defending the company after it took a 20% stock hit and comparing it to a company which just took a 2% hit is uh
I’m just continually shocked at the level of delusion
Additionally any impact on Cover’s stock is due to them spending a ton of money on new studios and making an American corporate branch which means they’d have less profit this year
Even shape wise Cover is doing better. Note how they recovered from it.
graph clearly going up: is apparently identical to the one going down and flat lining
going even lower most likely
wild
finana, say the word, and this kind ppls is need that word
not for your fuckin own fans
Niji fans really aren’t the brightest bunch, huh
leave it to the company that thinks 2% merch sales is a lot to give their employees
I never knew nijisanji stocks were so much more worth. I thought it would be the other way round.
Highest IQ NDF
These people are going to be running into financial problems in the future if they can’t see the difference.
Ah yes the decline of vtubing for niji
They live in a completely different universe, or they’re in the matrix. How do you think going up is the same as going down and then plateauing? You have to be a special level of delusional and coping.
Also, literally cover is almost worth as much as Niji per stock.
Flux is normal for Cover and Cover isn’t so utterly dependent on stock value like Niji is