
 EPS Slide Reinforces Cautious Narratives Despite Stable Margins")
Q3 2026 earnings snapshot
Tokyo Tekko (TSE:5445) has reported Q3 2026 revenue of ¥17.4b and basic EPS of ¥72. Over the past three quarters, revenue has moved from ¥19.3b in Q1 2026 to ¥17.5b in Q2 and ¥17.4b in Q3. Basic EPS shifted from ¥89.8 to ¥84.7 and then ¥72, creating a mixed backdrop for margins and profitability. For investors, the key focus now is how resilient those margins prove to be against this earnings profile.
See our full analysis for Tokyo Tekko.
With the headline numbers set, the next step is to see how this earnings run rate lines up against the most widely followed narratives around Tokyo Tekko, highlighting where the story still fits and where it starts to diverge.
Curious how numbers become stories that shape markets? Explore Community Narratives
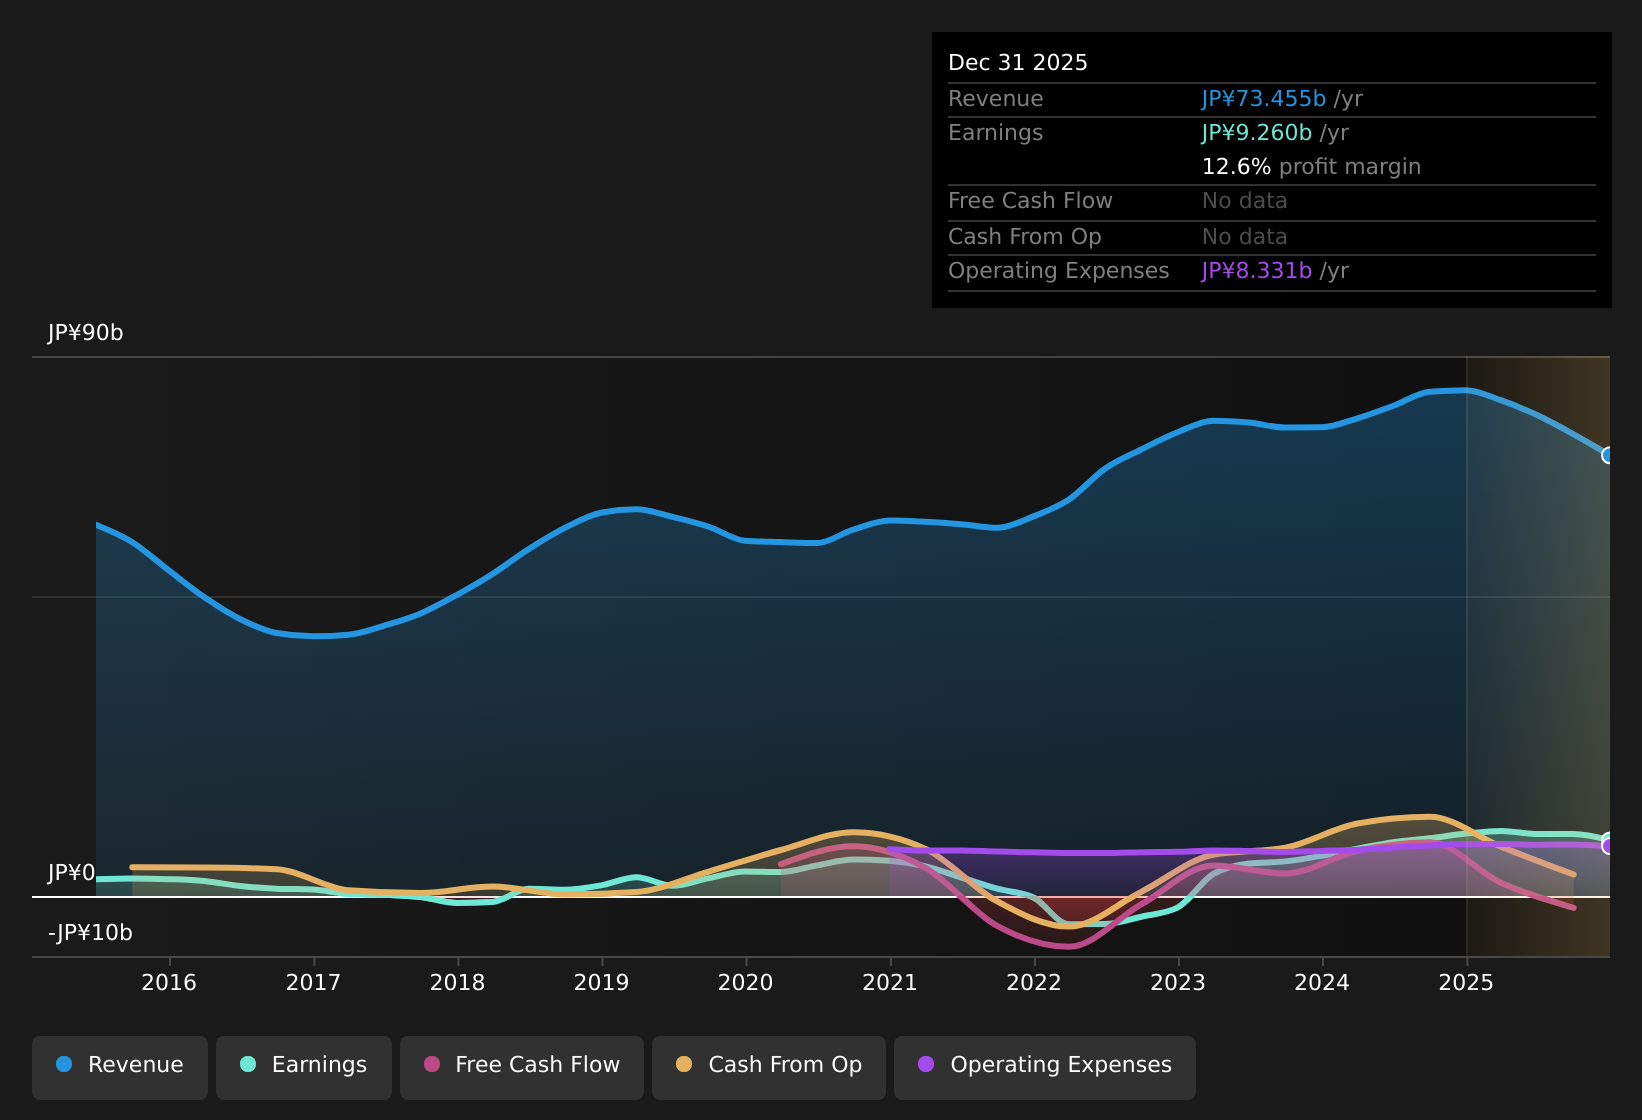 TSE:5445 Earnings & Revenue History as at May 2026 Margins hold around 12.6% on trailing basis Over the last 12 months, Tokyo Tekko recorded a 12.6% net profit margin compared with 12.3% in the prior year, while trailing 12 month net income reached ¥9,260 million on revenue of ¥73,455 million. What stands out for a mildly bullish angle is that this margin level sits alongside trailing 12 month basic EPS of ¥359.12, even though recent year on year earnings growth was negative, which contrasts with the 5 year compound earnings growth rate of about 38% per year.
This combination of a 12.6% margin and ¥9,260 million in net income supports the idea that the business has been able to earn meaningfully on its current revenue base, even as the latest 12 month earnings step down from earlier periods. At the same time, the drop from a trailing 12 month EPS of ¥412.89 in Q4 2025 to ¥359.12 in Q3 2026 challenges a straightforward bullish story that relies only on the long term growth rate and pushes investors to focus on what changed in the most recent year. Low 4.7x P/E against peers The trailing 12 month P/E ratio of 4.7x sits well below the JP Metals & Mining industry average of 12.6x, the peer average of 19.4x, and the broader JP market at 14.3x, with the stock trading at ¥1,932. Bears argue that the low multiple is not just a bargain signal but reflects concerns about recent earnings softness and cash generation, and the current data gives that view some support.
The trailing 12 month EPS decline from ¥412.89 to ¥359.12, combined with negative earnings growth over the most recent year, fits a cautious take that the market is pricing in weaker profit momentum even while margins remain at 12.6%. On top of that, the stock price of ¥1,932 sits above the DCF fair value of ¥1,595.59, which backs the bearish point that a low P/E alone does not automatically mean the stock is cheap when cash flow based valuation is considered. Dividend yield 5.18% with weak cash cover The stock offered a 5.18% dividend yield over the last year, but that payout was described as poorly covered by free cash flow, which sits alongside trailing 12 month net income of ¥9,260 million. Critics highlight this combination of high yield and weak cash coverage as a key risk, and the surrounding figures underline why income focused investors may want to look closely at sustainability.
Recent negative earnings growth, together with EPS easing from ¥398.04 in Q2 2026 to ¥359.12 on a trailing 12 month basis in Q3 2026, challenges any assumption that earnings alone can comfortably support a 5.18% payout. When that payout risk is set against a DCF fair value of ¥1,595.59 compared with the ¥1,932 share price, it adds to the cautious case that investors should understand the cash flow picture, not just the headline yield.
To see how these numbers fit into the wider conversation other investors are having about the stock, including valuation and risk angles, it is worth checking the latest shared views on Tokyo Tekko through Curious how numbers become stories that shape markets? Explore Community Narratives
Next Steps
Don’t just look at this quarter; the real story is in the long-term trend. We’ve done an in-depth analysis on Tokyo Tekko’s growth and its valuation to see if today’s price is a bargain. Add the company to your watchlist or portfolio now so you don’t miss the next big move.
Given the mix of cautious and optimistic signals in this earnings update, it makes sense to look at the underlying data yourself and decide how comfortable you are with the balance of risks and rewards, starting with the 1 key reward and 1 important warning sign.
See What Else Is Out There
Tokyo Tekko’s recent earnings softness, weaker free cash flow cover for its 5.18% dividend, and DCF fair value below the current price all raise sustainability questions.
If you’re concerned about payout strength and capital protection, it may be useful to shift your research toward companies with more robust income support using the 33 dividend fortresses.
This article by Simply Wall St is general in nature. We provide commentary based on historical data
and analyst forecasts only using an unbiased methodology and our articles are not intended to be financial advice. It does not constitute a recommendation to buy or sell any stock, and does not take account of your objectives, or your
financial situation. We aim to bring you long-term focused analysis driven by fundamental data.
Note that our analysis may not factor in the latest price-sensitive company announcements or qualitative material.
Simply Wall St has no position in any stocks mentioned.
Valuation is complex, but we’re here to simplify it.
Discover if Tokyo Tekko might be undervalued or overvalued with our detailed analysis, featuring fair value estimates, potential risks, dividends, insider trades, and its financial condition.
Access Free Analysis
Have feedback on this article? Concerned about the content? Get in touch with us directly. Alternatively, email editorial-team@simplywallst.com
AloJapan.com