
 Valuation After New Osaka Residential Acquisitions")
ORIX JREIT (TSE:8954) has agreed to acquire two newly completed residential properties in Osaka, Baysidepark Osaka South Residences and Baysidepark Osaka North Residences, in a move aimed at improving portfolio quality and supporting stable unitholder value.
See our latest analysis for ORIX JREIT.
At a share price of ¥101,300, ORIX JREIT has seen a 1 day share price return of 1.30% and a 7 day share price return of 2.63%, while its 1 year total shareholder return of 20.70% points to stronger longer term momentum despite weaker recent quarterly moves.
If this acquisition has you thinking about where else capital could work hard for you, consider widening your search with 10 top founder-led companies
With the units trading at ¥101,300 and third party estimates sitting higher, along with an indicated intrinsic value gap, you have to ask: is ORIX JREIT quietly undervalued, or is the market already pricing in its future growth?
Price-to-Earnings of 23.8x: Is it justified?
On a P/E of 23.8x and a last close of ¥101,300, ORIX JREIT screens as good value versus its own fair value estimates, yet looks expensive against regional office REIT peers.
The P/E multiple compares the current unit price with earnings per unit, so it effectively shows how much investors are paying for each unit of current profit. For a Japanese real estate investment corporation focused on income producing assets, this is a common yardstick because earnings are closely tied to rental income and financing costs.
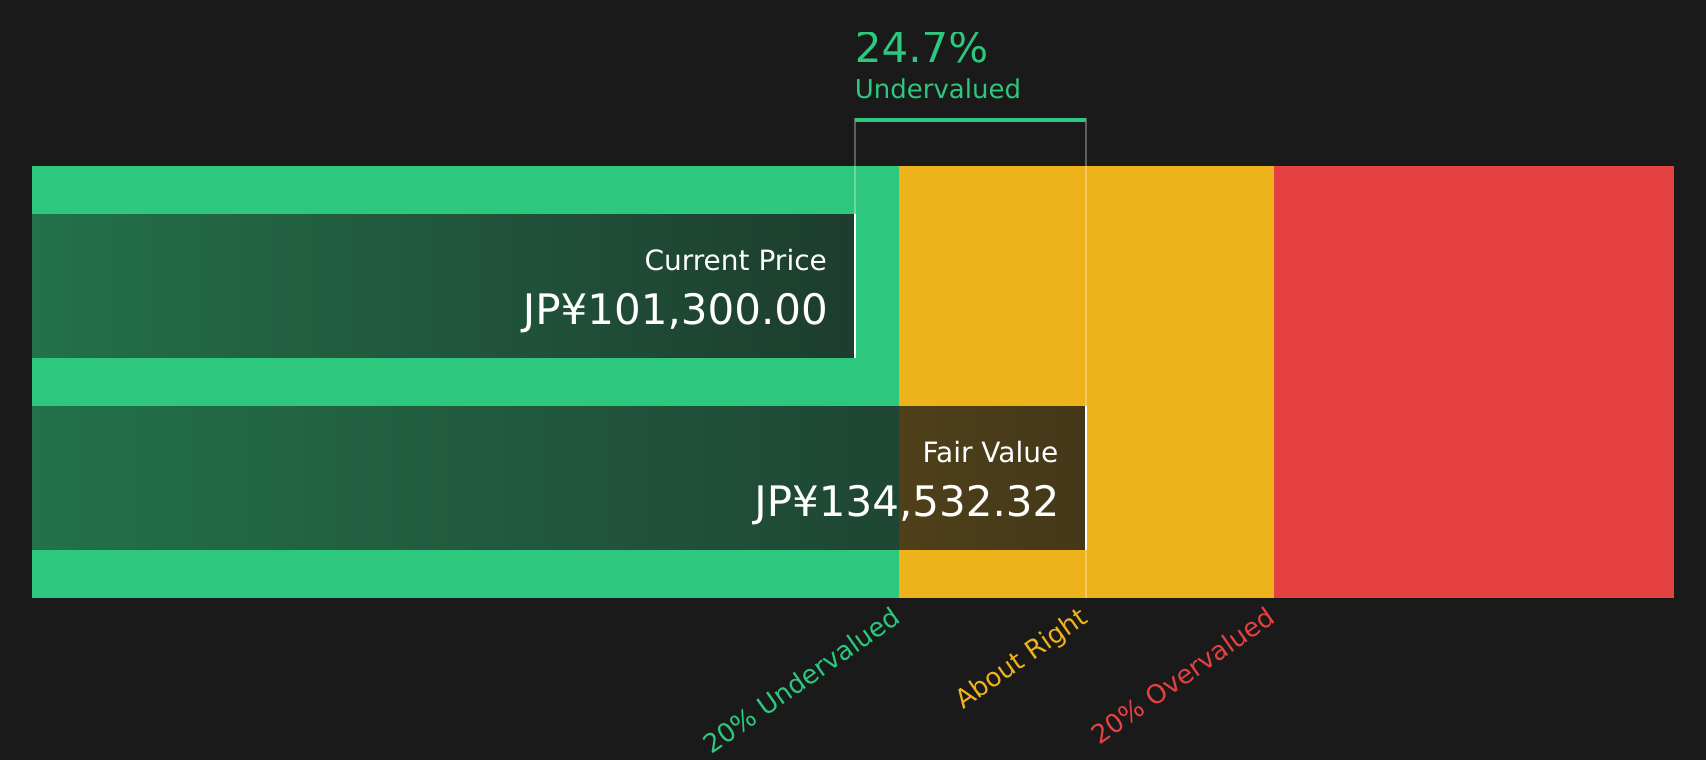
Based on Simply Wall St estimates, ORIX JREIT is trading at a 24.7% discount to an internal fair value estimate and at a discount to a discounted cash flow value of ¥134,532.32. This indicates the market price sits below an implied value of future cash flows. At the same time, a 23.8x P/E that matches the peer average suggests investors are not paying a premium relative to similar companies when only this peer set is considered.
Where the comparison shifts is at the broader Asian Office REIT industry level, where ORIX JREIT’s 23.8x P/E stands well above the 14.9x industry average. This implies the market currently values its earnings more highly than the wider group of regional office REITs.
See what the numbers say about this price — find out in our valuation breakdown.
Result: Price-to-Earnings of 23.8x (ABOUT RIGHT)
However, recent 90 day and year to date returns in negative territory, along with a higher P/E than wider Asian office peers, could challenge any simple undervaluation story.
Find out about the key risks to this ORIX JREIT narrative.
Another View: Cash Flows Tell a Different Story
If the 23.8x P/E leaves you on the fence, the SWS DCF model points in a different direction. With units at ¥101,300 versus an estimated future cash flow value of ¥134,532.32, this approach suggests the units trade at a discount. Which signal would you trust more when pricing ORIX JREIT?
Look into how the SWS DCF model arrives at its fair value.
 8954 Discounted Cash Flow as at Apr 2026
Simply Wall St performs a discounted cash flow (DCF) on every stock in the world every day (check out ORIX JREIT for example). We show the entire calculation in full. You can track the result in your watchlist or portfolio and be alerted when this changes, or use our stock screener to discover 17 high quality undervalued stocks. If you save a screener we even alert you when new companies match – so you never miss a potential opportunity.
Next Steps
Mixed signals across valuation methods and recent returns make this a good moment to look under the hood yourself and act while sentiment is still forming. To see how risks and potential upside compare, review the 3 key rewards and 1 important warning sign.
Looking for more investment ideas?
If ORIX JREIT has caught your eye, do not stop here. Fresh opportunities across other sectors could round out your watchlist and sharpen your next move.
This article by Simply Wall St is general in nature. We provide commentary based on historical data
and analyst forecasts only using an unbiased methodology and our articles are not intended to be financial advice. It does not constitute a recommendation to buy or sell any stock, and does not take account of your objectives, or your
financial situation. We aim to bring you long-term focused analysis driven by fundamental data.
Note that our analysis may not factor in the latest price-sensitive company announcements or qualitative material.
Simply Wall St has no position in any stocks mentioned.
New: AI Stock Screener & Alerts
Our new AI Stock Screener scans the market every day to uncover opportunities.
• Dividend Powerhouses (3%+ Yield)
• Undervalued Small Caps with Insider Buying
• High growth Tech and AI Companies
Or build your own from over 50 metrics.
Explore Now for Free
Have feedback on this article? Concerned about the content? Get in touch with us directly. Alternatively, email editorial-team@simplywallst.com
AloJapan.com