
 Stock Is Going Strong: Is the Market Following Fundamentals?")
W TOKYO’s (TSE:9159) stock is up by a considerable 34% over the past three months. Given the company’s impressive performance, we decided to study its financial indicators more closely as a company’s financial health over the long-term usually dictates market outcomes. Particularly, we will be paying attention to W TOKYO’s ROE today.
Return on equity or ROE is a key measure used to assess how efficiently a company’s management is utilizing the company’s capital. Put another way, it reveals the company’s success at turning shareholder investments into profits.
Trump has pledged to “unleash” American oil and gas and these 15 US stocks have developments that are poised to benefit.
How Is ROE Calculated?
ROE can be calculated by using the formula:
Return on Equity = Net Profit (from continuing operations) ÷ Shareholders’ Equity
So, based on the above formula, the ROE for W TOKYO is:
11% = JP¥173m ÷ JP¥1.6b (Based on the trailing twelve months to June 2025).
The ‘return’ is the profit over the last twelve months. That means that for every ¥1 worth of shareholders’ equity, the company generated ¥0.11 in profit.
View our latest analysis for W TOKYO
What Is The Relationship Between ROE And Earnings Growth?
We have already established that ROE serves as an efficient profit-generating gauge for a company’s future earnings. Based on how much of its profits the company chooses to reinvest or “retain”, we are then able to evaluate a company’s future ability to generate profits. Assuming all else is equal, companies that have both a higher return on equity and higher profit retention are usually the ones that have a higher growth rate when compared to companies that don’t have the same features.
A Side By Side comparison of W TOKYO’s Earnings Growth And 11% ROE
At first glance, W TOKYO seems to have a decent ROE. Further, the company’s ROE compares quite favorably to the industry average of 8.2%. This certainly adds some context to W TOKYO’s exceptional 32% net income growth seen over the past five years. However, there could also be other causes behind this growth. Such as – high earnings retention or an efficient management in place.
Next, on comparing with the industry net income growth, we found that W TOKYO’s growth is quite high when compared to the industry average growth of 8.3% in the same period, which is great to see.
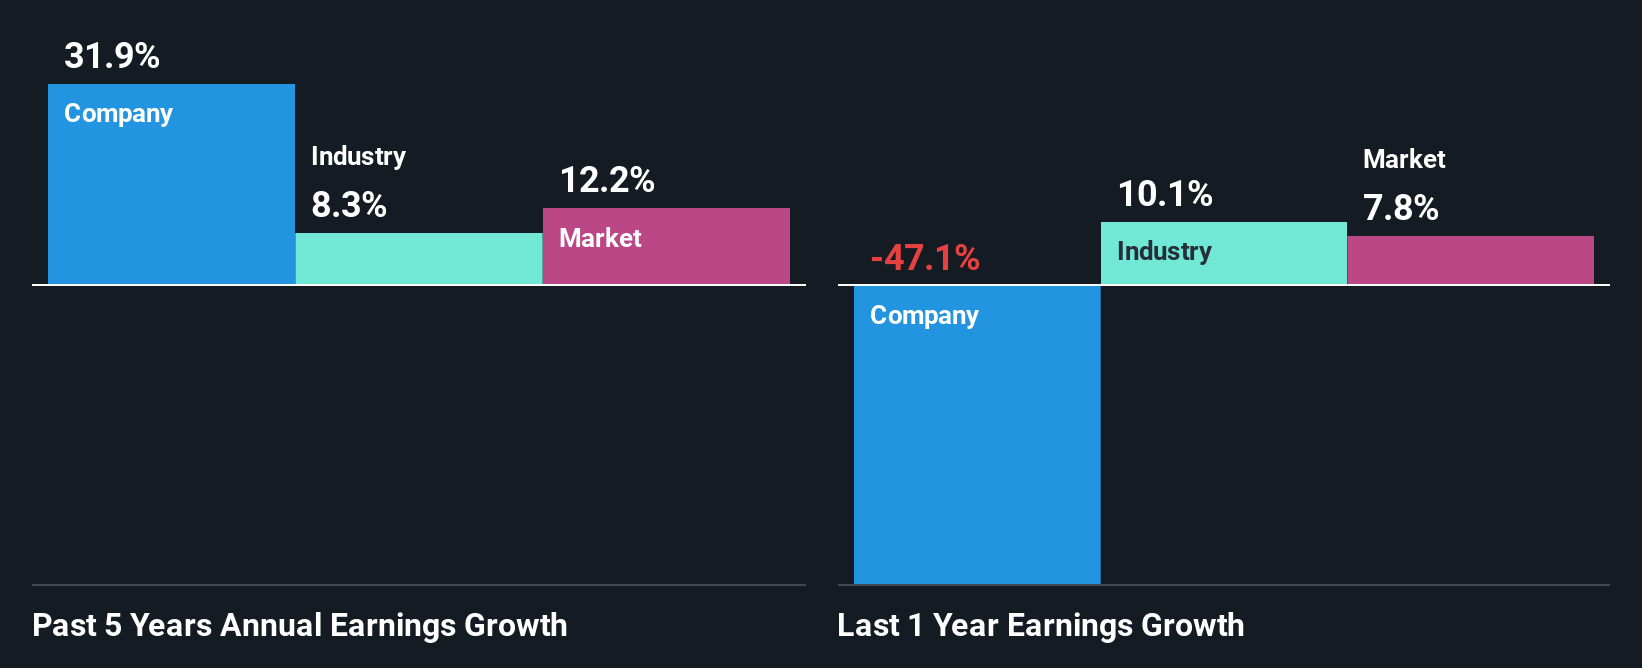 TSE:9159 Past Earnings Growth October 2nd 2025
The basis for attaching value to a company is, to a great extent, tied to its earnings growth. What investors need to determine next is if the expected earnings growth, or the lack of it, is already built into the share price. Doing so will help them establish if the stock’s future looks promising or ominous. Is 9159 fairly valued? This infographic on the company’s intrinsic value has everything you need to know.
Is W TOKYO Using Its Retained Earnings Effectively?
W TOKYO doesn’t pay any regular dividends currently which essentially means that it has been reinvesting all of its profits into the business. This definitely contributes to the high earnings growth number that we discussed above.
Conclusion
In total, we are pretty happy with W TOKYO’s performance. Particularly, we like that the company is reinvesting heavily into its business, and at a high rate of return. Unsurprisingly, this has led to an impressive earnings growth. If the company continues to grow its earnings the way it has, that could have a positive impact on its share price given how earnings per share influence long-term share prices. Not to forget, share price outcomes are also dependent on the potential risks a company may face. So it is important for investors to be aware of the risks involved in the business. Our risks dashboard would have the 3 risks we have identified for W TOKYO.
Valuation is complex, but we’re here to simplify it.
Discover if W TOKYO might be undervalued or overvalued with our detailed analysis, featuring fair value estimates, potential risks, dividends, insider trades, and its financial condition.
Access Free Analysis
Have feedback on this article? Concerned about the content? Get in touch with us directly. Alternatively, email editorial-team (at) simplywallst.com.
This article by Simply Wall St is general in nature. We provide commentary based on historical data and analyst forecasts only using an unbiased methodology and our articles are not intended to be financial advice. It does not constitute a recommendation to buy or sell any stock, and does not take account of your objectives, or your financial situation. We aim to bring you long-term focused analysis driven by fundamental data. Note that our analysis may not factor in the latest price-sensitive company announcements or qualitative material. Simply Wall St has no position in any stocks mentioned.
AloJapan.com