

If you are looking at Osaka Gas right now and wondering if it is the right moment to buy, hold, or sell, you are definitely not alone. The stock has been on quite a ride recently, dipping 3.0% over the past week and down 1.9% over the last month, but zoom out and the picture shifts dramatically. Year-to-date, Osaka Gas has surged an impressive 22.7%, and over the past year the gain reaches a robust 34.1%. Even more compelling, the three- and five-year returns clock in at 108.7% and a stunning 124.9%. These sorts of numbers naturally draw attention from anyone weighing their next move.
It is not just momentum driving this interest, either. Changing market dynamics, including shifting global energy demands and supply chain adjustments, have caused investors to reassess the entire sector’s risk and growth outlook. For Osaka Gas in particular, there is a sense that the risks may be becoming more manageable, or that its growth opportunities are stronger than they once appeared. Still, with a value score of 2 out of 6 based on classic valuation checks, there is plenty to dissect about whether the current price offers undiscovered value or if the rally has already priced in most of the upside.
In the next section, we will break down Osaka Gas’s valuation through a range of common approaches, and touch on whether these traditional metrics tell the whole story, or if another angle might actually offer a smarter way to measure the stock’s true worth.
Osaka Gas scores just 2/6 on our valuation checks. See what other red flags we found in the full valuation breakdown. Approach 1: Osaka Gas Discounted Cash Flow (DCF) Analysis
The Discounted Cash Flow (DCF) model is a common approach for estimating a company’s intrinsic value. It works by projecting the business’s future free cash flows and then discounting those amounts back to today’s value, giving investors a present-day assessment of what those future earnings are worth.
For Osaka Gas, the latest reported Free Cash Flow stands at ¥89.38 billion. Analysts provide cash flow estimates for the next five years, after which models extrapolate based on expected trends. By 2030, projections show Free Cash Flow at ¥31.10 billion, reflecting anticipated fluctuations and sector dynamics. These forecasts, coupled with a 2 Stage Free Cash Flow to Equity model, underpin the current DCF valuation for Osaka Gas.
According to this DCF analysis, the estimated fair value of Osaka Gas shares is ¥2,089.59. However, the DCF-implied discount shows the stock is trading 103.1% above its intrinsic value, meaning shares are significantly overvalued based on long-term cash flow outlook.
Result: OVERVALUED
Head to the Valuation section of our Company Report for more details on how we arrive at this Fair Value for Osaka Gas. 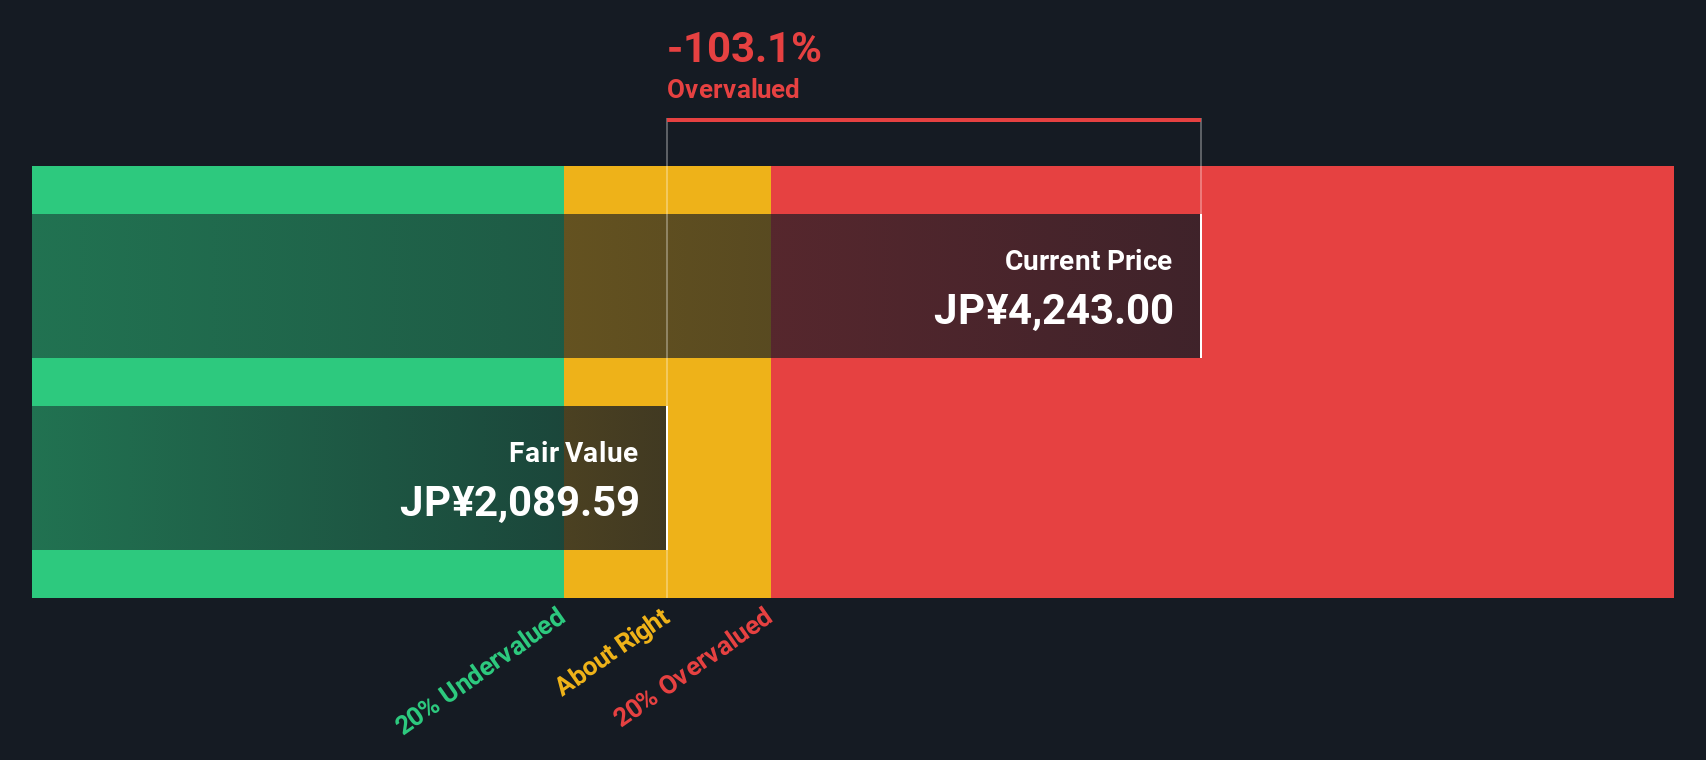 9532 Discounted Cash Flow as at Sep 2025 Our Discounted Cash Flow (DCF) analysis suggests Osaka Gas may be overvalued by 103.1%. Find undervalued stocks or create your own screener to find better value opportunities.
Approach 2: Osaka Gas Price vs Earnings
The price-to-earnings (PE) ratio is a favored valuation tool for profitable companies like Osaka Gas because it reflects how much investors are willing to pay for each unit of earnings. Generally, higher growth expectations or a lower risk profile warrant a higher “normal” PE ratio, while slower growth or higher risk would call for a lower one.
Currently, Osaka Gas trades at a PE ratio of 11.0x. That is below the Gas Utilities industry average of 13.2x and also lags the average of its direct peers, which sits at 15.6x. On the surface, this might suggest the stock is undervalued compared to others in its sector.
Rather than just comparing straight multiples, Simply Wall St’s “Fair Ratio” model takes things a step further. This proprietary calculation blends factors specific to Osaka Gas, such as its earnings growth outlook, profit margins, risk profile, industry type, and market cap, to better estimate the multiple the stock truly deserves. Based on these inputs, the Fair Ratio is 8.7x.
With Osaka Gas’s actual PE slightly above its Fair Ratio, it appears the shares are trading a bit ahead of their fundamentals, though not by a wide margin. This suggests investors are paying just a modest premium over what the numbers justify.
Result: OVERVALUED
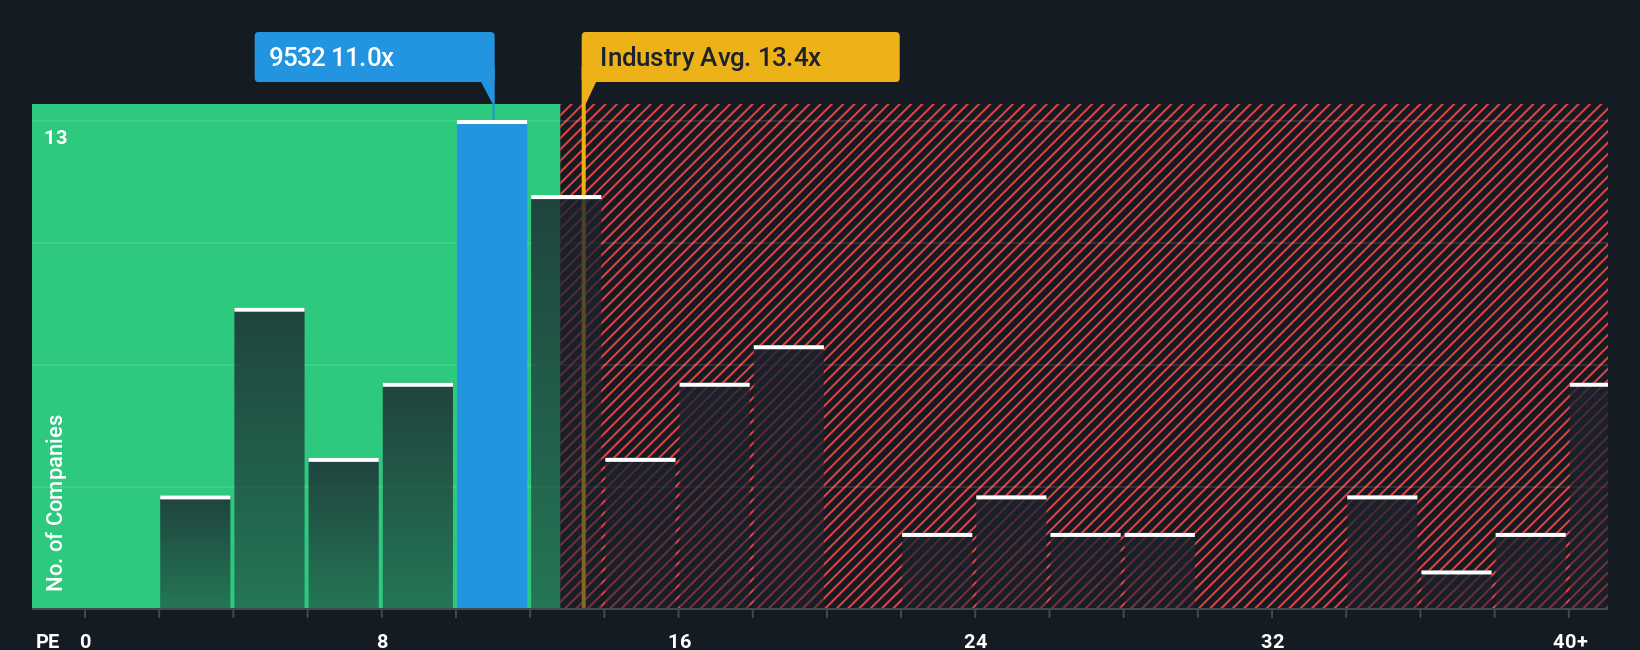 TSE:9532 PE Ratio as at Sep 2025 PE ratios tell one story, but what if the real opportunity lies elsewhere? Discover companies where insiders are betting big on explosive growth. Upgrade Your Decision Making: Choose your Osaka Gas Narrative
Earlier we mentioned that there is an even better way to understand valuation. Let’s introduce you to Narratives. A Narrative is a simple, investor-driven story that connects your view of a company, like Osaka Gas, to clear financial forecasts and a straightforward fair value. It shifts the focus from just crunching numbers to explaining why you think the company will perform a certain way, based on your assumptions about future revenue, earnings, and margins.
Narratives are easily accessible and widely used on Simply Wall St’s Community page, helping millions of investors tie together the latest news, earnings, and market developments with their own forecasts. They let you see how your valuation compares to others in real time, making it easier to spot opportunities or risks and decide if today’s price is above or below your fair value estimate.
What is unique is that Narratives automatically update when new information drops, keeping your analysis fresh and relevant. For example, one investor’s Narrative might value Osaka Gas at ¥2,400, while another sees a fair value as low as ¥1,500, reflecting how personal perspectives and expectations can shape different investment decisions.
Do you think there’s more to the story for Osaka Gas? Create your own Narrative to let the Community know! 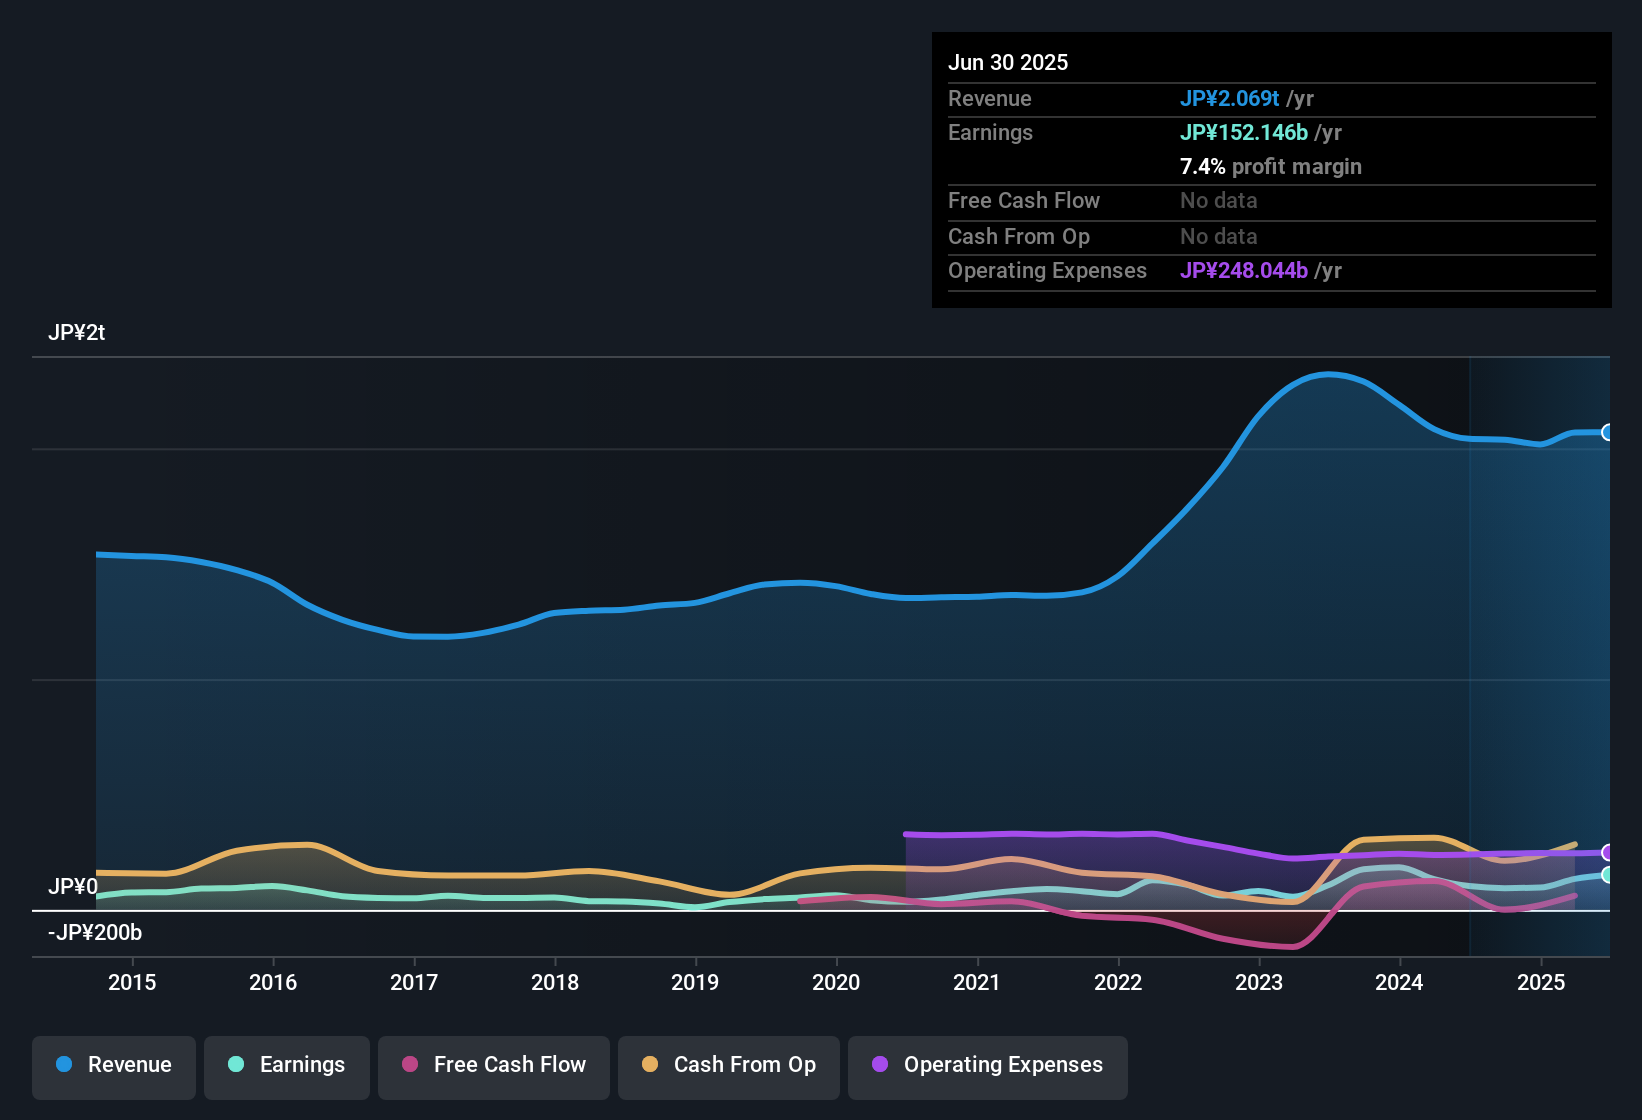 TSE:9532 Earnings & Revenue History as at Sep 2025
This article by Simply Wall St is general in nature. We provide commentary based on historical data
and analyst forecasts only using an unbiased methodology and our articles are not intended to be financial advice. It does not constitute a recommendation to buy or sell any stock, and does not take account of your objectives, or your
financial situation. We aim to bring you long-term focused analysis driven by fundamental data.
Note that our analysis may not factor in the latest price-sensitive company announcements or qualitative material.
Simply Wall St has no position in any stocks mentioned.
New: AI Stock Screener & Alerts
Our new AI Stock Screener scans the market every day to uncover opportunities.
• Dividend Powerhouses (3%+ Yield)
• Undervalued Small Caps with Insider Buying
• High growth Tech and AI Companies
Or build your own from over 50 metrics.
Explore Now for Free
Have feedback on this article? Concerned about the content? Get in touch with us directly. Alternatively, email editorial-team@simplywallst.com
AloJapan.com