
 One Off Gain Clouds Q1 Earnings Narratives")
Osaka Organic Chemical Industry (TSE:4187) has opened Q1 2026 with total revenue of ¥9.1b and basic EPS of ¥63.18, setting the tone for how investors will judge the latest quarter against a year of stronger trailing margins and one off gains. Over recent periods the company has seen quarterly revenue move from ¥8.5b in Q1 2025 to ¥9.6b in Q4 2025 and EPS shift from ¥49.96 to ¥169.63. This new print therefore slots into a year where the trailing net margin reached 19.4% versus 13.1% a year earlier and puts the focus squarely on how much of that profitability is repeatable.
See our full analysis for Osaka Organic Chemical Industry.
With the headline numbers on the table, the next step is to set them against the widely shared bull and bear narratives to see which stories the latest margins support and which are pushed into question.
Curious how numbers become stories that shape markets? Explore Community Narratives
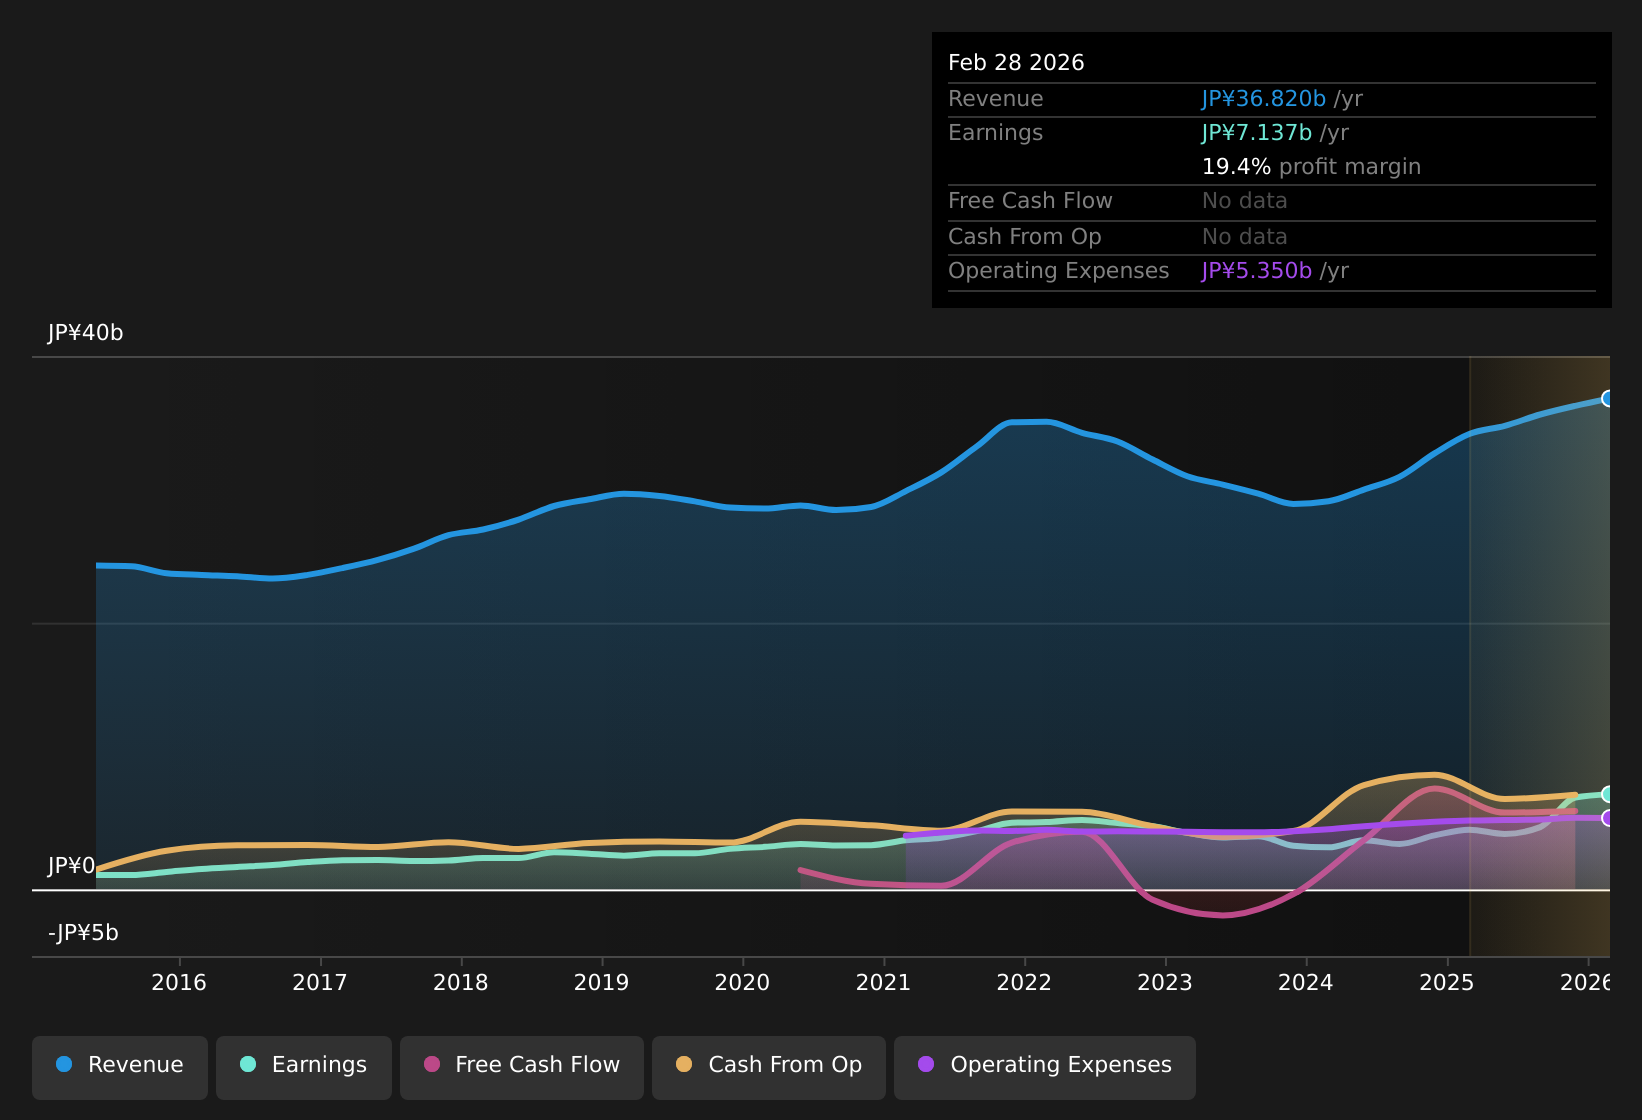 TSE:4187 Earnings & Revenue History as at Apr 2026 ¥7.1b net income over last 12 months On a trailing 12 month basis, net income excluding extra items is ¥7,136.6m on revenue of ¥36,820.1m, which lines up with the 19.4% net margin figure mentioned earlier. What stands out for a bullish angle is that this trailing profit includes a ¥3,100m one off gain, so investors who focus on specialty chemicals and electronic materials exposure may see the higher 19.4% margin as supportive, yet need to separate that one off from the more routine quarterly net income figures of around ¥1,096.6m to ¥1,302.97m seen across most of 2025 to judge how durable that margin really is.
For example, Q1 2026 net income of ¥1,285m is close to Q3 2025 at ¥1,302.97m and Q4 2024 at ¥1,231m, which points to a similar level of underlying profit even without the large gain. Investors who like the business mix in electronic materials and cosmetics ingredients can point to this consistency as support for the bullish story, while still treating the ¥3,100m gain as a separate, non recurring boost.
Results like these often lead investors to ask whether the recent profit strength can keep playing out once the one-off fades, and that is exactly what longer-form community narratives tend to unpack in more detail, across multiple viewpoints and time horizons. Curious how numbers become stories that shape markets? Explore Community Narratives.
Forecast earnings decline versus price Analysts expect earnings to decline about 7.3% per year over the next three years even though revenue is forecast to grow around 6.5% per year, and the current share price of ¥3,960 sits below a ¥4,812.50 analyst price target but slightly above the DCF fair value of ¥3,842.31. Bears argue that a forecast earnings decline combined with recent volatility and an unstable dividend record makes the stock sensitive if growth expectations slip, and the numbers give them several talking points.
The projected 7.3% annual drop in earnings contrasts with the higher trailing margin of 19.4% and the 59.4% earnings growth reported over the last year, highlighting a gap between recent results and forward expectations. At the same time, the trailing P/E of 11.3x is below both peer and industry averages, while the share price is close to the ¥3,842.31 DCF fair value and below the ¥4,812.50 target, so some investors will see valuation room while others focus more on the earnings decline and volatility risk. Quarterly EPS swings and one off impact Quarterly basic EPS has ranged from about ¥49.96 in Q1 2025 to ¥169.63 in Q4 2025 and ¥63.18 in Q1 2026, with the trailing 12 month EPS now at ¥350.52, which is higher than the ¥212.83 level recorded a year earlier on a trailing basis. What is surprising for both bullish and bearish readers is how much of the jump in trailing EPS and the move from a 13.1% to 19.4% net margin is tied to the ¥3,100m one off gain, because that gain lifted 12 month earnings on paper even though the underlying quarterly EPS in most periods sits in a much narrower band between roughly ¥50 and ¥64.
For instance, Q2 2025 EPS was ¥53.77 and Q3 2025 EPS was ¥63.99, which are both close to the Q1 2026 print of ¥63.18, suggesting the core business is producing a similar per share result once the Q4 spike is set aside. Critics highlight that any investment case which leans heavily on the high trailing EPS of ¥350.52 and the 59.4% earnings growth number needs to adjust for the one off, otherwise comparisons across years and against forecasts for a 7.3% earnings decline can look misleading. Next Steps
Don’t just look at this quarter; the real story is in the long-term trend. We’ve done an in-depth analysis on Osaka Organic Chemical Industry’s growth and its valuation to see if today’s price is a bargain. Add the company to your watchlist or portfolio now so you don’t miss the next big move.
With mixed signals on earnings, margins and one off gains, this is a moment to look closely at the details and decide how they fit with your own risk tolerance and goals, and it is worth weighing both sides carefully alongside 4 key rewards and 4 important warning signs
See What Else Is Out There
The heavy reliance on a ¥3,100m one off gain, forecast 7.3% earnings decline and unstable dividend record all raise questions about consistency and downside risk.
If that mix of one off boosts, forecast pressure and volatility feels uncomfortable, shift some attention to 48 resilient stocks with low risk scores to quickly focus on companies with steadier risk profiles and potentially fewer surprises.
This article by Simply Wall St is general in nature. We provide commentary based on historical data
and analyst forecasts only using an unbiased methodology and our articles are not intended to be financial advice. It does not constitute a recommendation to buy or sell any stock, and does not take account of your objectives, or your
financial situation. We aim to bring you long-term focused analysis driven by fundamental data.
Note that our analysis may not factor in the latest price-sensitive company announcements or qualitative material.
Simply Wall St has no position in any stocks mentioned.
New: AI Stock Screener & Alerts
Our new AI Stock Screener scans the market every day to uncover opportunities.
• Dividend Powerhouses (3%+ Yield)
• Undervalued Small Caps with Insider Buying
• High growth Tech and AI Companies
Or build your own from over 50 metrics.
Explore Now for Free
Have feedback on this article? Concerned about the content? Get in touch with us directly. Alternatively, email editorial-team@simplywallst.com
AloJapan.com