
 Valuation After New FY2027.3 Plan And Executive Changes")
Osaka Gas (TSE:9532) updated investors on March 13, outlining its FY2027.3 financial plan for the Daigas Group and announcing planned senior executive reshuffles that could reshape responsibilities across core subsidiaries.
See our latest analysis for Osaka Gas.
The share price has recently eased, with a 1 month share price return of 5.44%, after a 90 day share price return of 17.25%. The 1 year total shareholder return of 87.30% and 5 year total shareholder return of 230.43% highlight strong longer term momentum as investors weigh the new FY2027.3 guidance and leadership changes against the current price of ¥6,279.
If Osaka Gas’s update has you thinking about where the next energy transition winners might come from, this could be a good moment to scan 26 power grid technology and infrastructure stocks
After a rapid multi year run, a recent 1 month pullback and a share price slightly above the latest analyst target raise a simple question for you: is Osaka Gas now overextended or still offering future growth at a fair entry point?
Price-to-Earnings of 13.2x: Is it justified?
On a P/E of 13.2x against a last close of ¥6,279, Osaka Gas screens cheaper than many peers, yet some models flag the shares as expensive.
The P/E ratio compares the current share price to earnings per share, so it reflects how much you are paying for each unit of current earnings. For a mature utility that already generates high quality earnings, this multiple can hint at how the market is weighing stability against future profit expectations.
Analyst and model checks give a mixed picture. Osaka Gas trades on a lower P/E than both the JP market average of 14.7x and an estimated peer average of 17.5x, which points to a discount. However, the fair P/E ratio based on Simply Wall St’s regression model is 11.1x, which is below the current 13.2x, so part of the share price is sitting above where that fair ratio model could pull it over time.
Against the broader Asian Gas Utilities industry average P/E of 15.5x, Osaka Gas again sits at a lower multiple, so the shares are not priced at a premium to sector earnings. The tension is between that apparent discount to peers and the higher level than the modelled fair P/E. That is where investors will have to make a judgment on the sustainability of recent earnings strength versus forecasts pointing to earnings declines.
Explore the SWS fair ratio for Osaka Gas
Result: Price-to-Earnings of 13.2x (ABOUT RIGHT)
However, a 1.7% premium to the ¥6,156 analyst target, along with recent annual revenue and net income declines, could challenge the case for paying up at current levels.
Find out about the key risks to this Osaka Gas narrative.
Another view: DCF sends a different signal
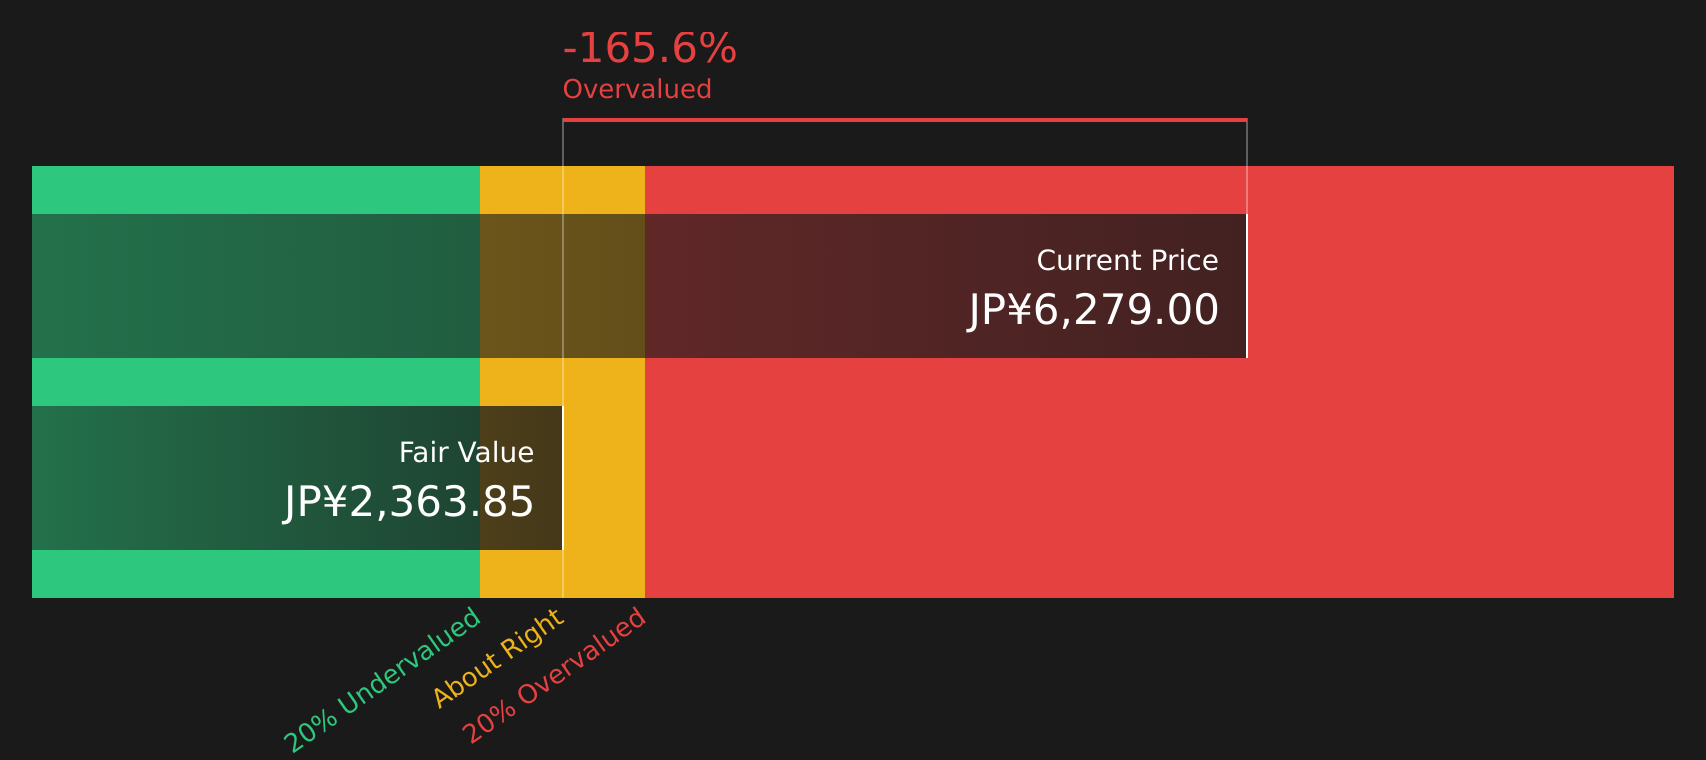
While the 13.2x P/E suggests Osaka Gas trades at a discount to peers, the SWS DCF model points the other way. With the share price at ¥6,279 versus an estimated future cash flow value of ¥2,363.85, the model frames the stock as expensive. Which lens do you trust more for a long term call?
Look into how the SWS DCF model arrives at its fair value.
 9532 Discounted Cash Flow as at Mar 2026
Simply Wall St performs a discounted cash flow (DCF) on every stock in the world every day (check out Osaka Gas for example). We show the entire calculation in full. You can track the result in your watchlist or portfolio and be alerted when this changes, or use our stock screener to discover 23 high quality undervalued stocks. If you save a screener we even alert you when new companies match – so you never miss a potential opportunity.
Next Steps
With such a mixed picture on value and outlook, it makes sense to move quickly, test the numbers yourself, and balance both the risks and potential rewards by reviewing the 3 key rewards and 1 important warning sign.
Looking for more investment ideas?
If Osaka Gas is already on your radar, do not stop there. Cast the net wider so you do not miss other opportunities that fit your style.
Spot potential mispriced leaders by scanning 23 high quality undervalued stocks, and compare how their valuations stack up against the quality of their earnings and balance sheets. Strengthen your income focus by checking 20 dividend fortresses, so you can see which high yielding names also back those payouts with resilient fundamentals. Reduce unwanted surprises by reviewing 49 resilient stocks with low risk scores, giving yourself a shortlist of companies that score well on financial stability and risk metrics.
This article by Simply Wall St is general in nature. We provide commentary based on historical data
and analyst forecasts only using an unbiased methodology and our articles are not intended to be financial advice. It does not constitute a recommendation to buy or sell any stock, and does not take account of your objectives, or your
financial situation. We aim to bring you long-term focused analysis driven by fundamental data.
Note that our analysis may not factor in the latest price-sensitive company announcements or qualitative material.
Simply Wall St has no position in any stocks mentioned.
New: AI Stock Screener & Alerts
Our new AI Stock Screener scans the market every day to uncover opportunities.
• Dividend Powerhouses (3%+ Yield)
• Undervalued Small Caps with Insider Buying
• High growth Tech and AI Companies
Or build your own from over 50 metrics.
Explore Now for Free
Have feedback on this article? Concerned about the content? Get in touch with us directly. Alternatively, email editorial-team@simplywallst.com
AloJapan.com