
 Valuation After Strong Recent Share Price Momentum")
What recent price moves in Osaka Gas might mean for investors
Recent share price moves in Osaka Gas (TSE:9532), including a 6.6% return over the past month and 28.6% over the past 3 months, have put the utility stock back on many investors’ watchlists.
See our latest analysis for Osaka Gas.
With the share price at ¥6,646, Osaka Gas has a 30-day share price return of 6.6% and a 90-day share price return of 28.7%. The 1-year total shareholder return of 104.5% suggests momentum has been strong over a longer horizon as investors reassess growth prospects and risks around its diversified energy and infrastructure businesses.
If Osaka Gas has caught your eye, it could be a good moment to see what else is moving in essential infrastructure and grid-related names through our 24 power grid technology and infrastructure stocks.
With Osaka Gas trading at ¥6,646 and sitting above the average analyst price target while screening with a low value score, investors may wonder whether there is still upside on the table or if the market is already pricing in future growth.
Price-to-Earnings of 13.9x: Is it justified?
Osaka Gas currently trades on a P/E of 13.9x, which sits below both the wider JP market and its gas utility peers, even after the sharp share price move.
The P/E multiple compares the current share price to earnings per share, so it effectively shows how much investors are paying for each unit of current profit. For a mature utilities group with established cash flows across gas, power and related services, this is a commonly watched gauge of how the market is pricing those earnings against alternatives.
Based on the statements, the 13.9x P/E looks inexpensive compared with the Asian Gas Utilities industry average of 15.5x and the peer average of 18x. However, it is above the estimated fair P/E of 11.1x that our model suggests the market could gravitate toward. This tension between being cheaper than peers but richer than the fair ratio helps explain why Osaka Gas screens with a low value score even after strong profit growth and higher net margins.
Explore the SWS fair ratio for Osaka Gas
Result: Price-to-Earnings of 13.9x (ABOUT RIGHT)
However, you still need to weigh risks such as recent annual net income and revenue declines, as well as the shares trading above the average analyst target price.
Find out about the key risks to this Osaka Gas narrative.
Another way to look at value
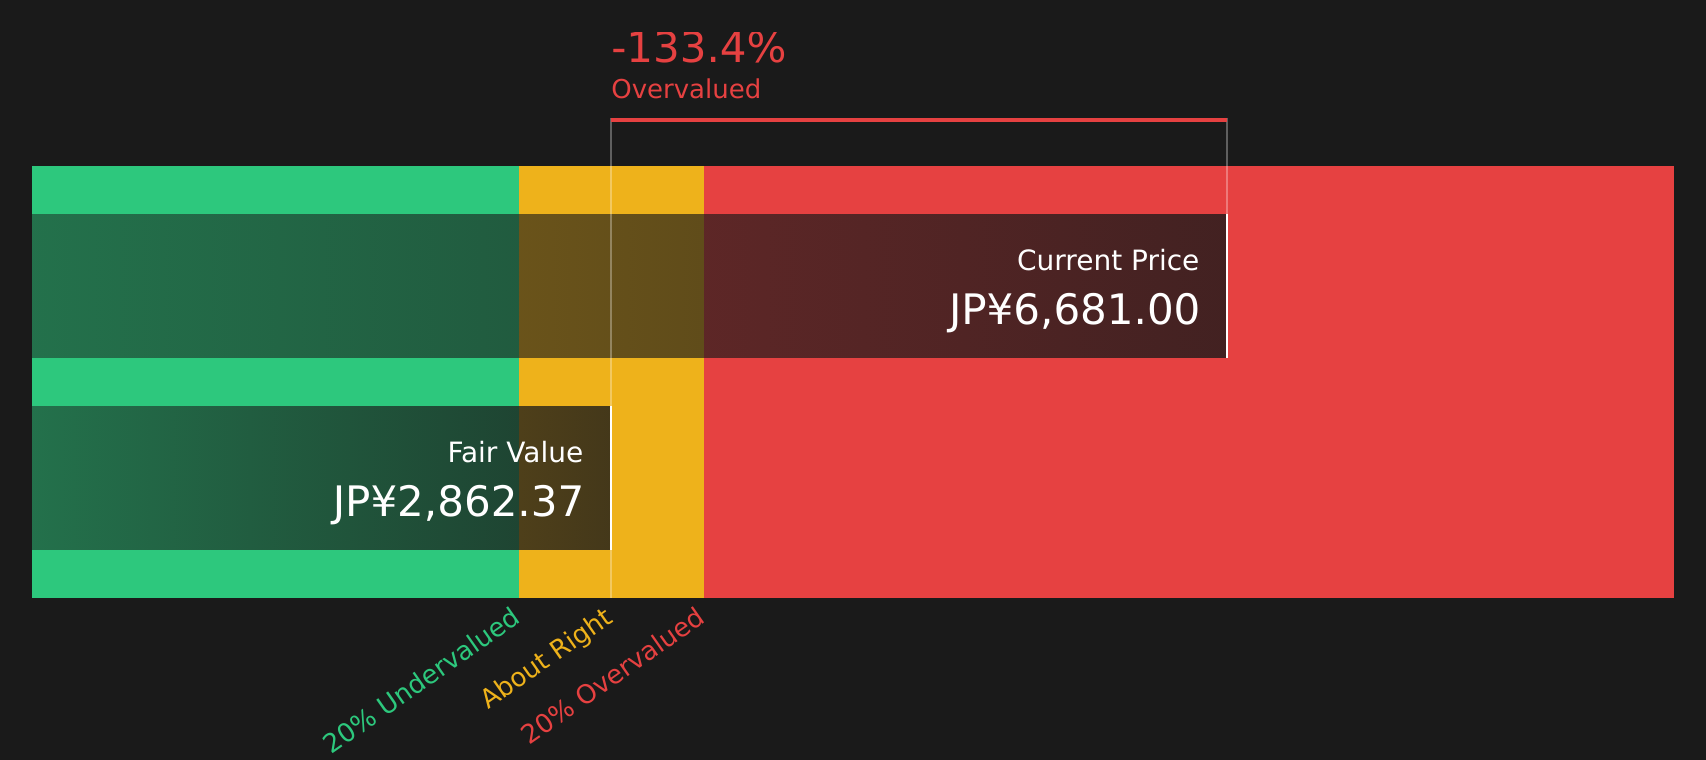
While the current 13.9x P/E looks reasonable next to peers, our DCF model presents a different perspective. With Osaka Gas at ¥6,646 versus an estimated future cash flow value of ¥2,862.37, the DCF view suggests a relatively high price. Which lens do you rely on more for a long term hold?
Look into how the SWS DCF model arrives at its fair value.
 9532 Discounted Cash Flow as at Mar 2026
Simply Wall St performs a discounted cash flow (DCF) on every stock in the world every day (check out Osaka Gas for example). We show the entire calculation in full. You can track the result in your watchlist or portfolio and be alerted when this changes, or use our stock screener to discover 24 high quality undervalued stocks. If you save a screener we even alert you when new companies match – so you never miss a potential opportunity.
Next Steps
With a mix of concerns and positives in the story so far, it makes sense to look at the numbers yourself and decide quickly where you stand. Our breakdown of 3 key rewards and 1 important warning sign can help you weigh both sides before you commit fresh capital.
Looking for more investment ideas?
If Osaka Gas does not fully match your goals, broaden your watchlist now and give yourself more options before the next round of market moves.
This article by Simply Wall St is general in nature. We provide commentary based on historical data
and analyst forecasts only using an unbiased methodology and our articles are not intended to be financial advice. It does not constitute a recommendation to buy or sell any stock, and does not take account of your objectives, or your
financial situation. We aim to bring you long-term focused analysis driven by fundamental data.
Note that our analysis may not factor in the latest price-sensitive company announcements or qualitative material.
Simply Wall St has no position in any stocks mentioned.
New: AI Stock Screener & Alerts
Our new AI Stock Screener scans the market every day to uncover opportunities.
• Dividend Powerhouses (3%+ Yield)
• Undervalued Small Caps with Insider Buying
• High growth Tech and AI Companies
Or build your own from over 50 metrics.
Explore Now for Free
Have feedback on this article? Concerned about the content? Get in touch with us directly. Alternatively, email editorial-team@simplywallst.com
AloJapan.com