
 Valuation Check After Strong Multi Year Shareholder Returns")
Osaka Gas: recent share move and what it might mean for investors
Osaka Gas (TSE:9532) has caught investor attention after its share price move over the past month, prompting fresh questions around how its current valuation lines up with recent business performance.
See our latest analysis for Osaka Gas.
While the latest move has been fairly quiet, Osaka Gas sits at ¥6,448 after a strong 30 day share price return of 12.16% and a year to date share price return of 18.53%, alongside a 1 year total shareholder return of 95.69%. This points to momentum built over several years, with 3 and 5 year total shareholder returns of 218.33% and 282.92% respectively, which hints at shifting expectations around its long term earnings power and risk profile.
If Osaka Gas’s recent run has you thinking more broadly about energy and infrastructure, it could be a good time to check out 24 power grid technology and infrastructure stocks as another source of investment ideas.
With Osaka Gas trading at ¥6,448, a value score of 2 and revenue and net income that are currently flat to slightly weaker, the key question is whether the recent share price strength still leaves an opportunity to invest at an attractive price or if the market is already pricing in future growth.
Price-to-Earnings of 13.5x: Is it justified?
Osaka Gas is trading on a P/E of 13.5x at a share price of ¥6,448, which sits below both the broader JP market P/E of 15.2x and the Asian gas utilities peer average of 14.1x, even though it is described as expensive relative to an estimated fair P/E of 9.8x.
The P/E ratio compares the current share price with earnings per share, so a higher multiple usually means investors are paying more for each unit of profit. For a utility group like Osaka Gas, which combines regulated energy operations with international projects and non energy businesses, the P/E can reflect how the market views the stability and quality of its earnings stream.
Here, the company screens as “good value” against both the JP market and its regional gas utilities peers on P/E. This suggests investors are paying less for Osaka Gas earnings than for similar companies. At the same time, the SWS fair P/E estimate of 9.8x sits well below the current 13.5x. This points to a level the market could move towards if expectations around future profit and risk cool off.
Explore the SWS fair ratio for Osaka Gas
Result: Price-to-Earnings of 13.5x (OVERVALUED)
However, the flat to weaker revenue and net income, together with Osaka Gas trading above the latest analyst price target, could challenge the recent momentum story.
Find out about the key risks to this Osaka Gas narrative.
Another way to look at value: DCF signal is much colder
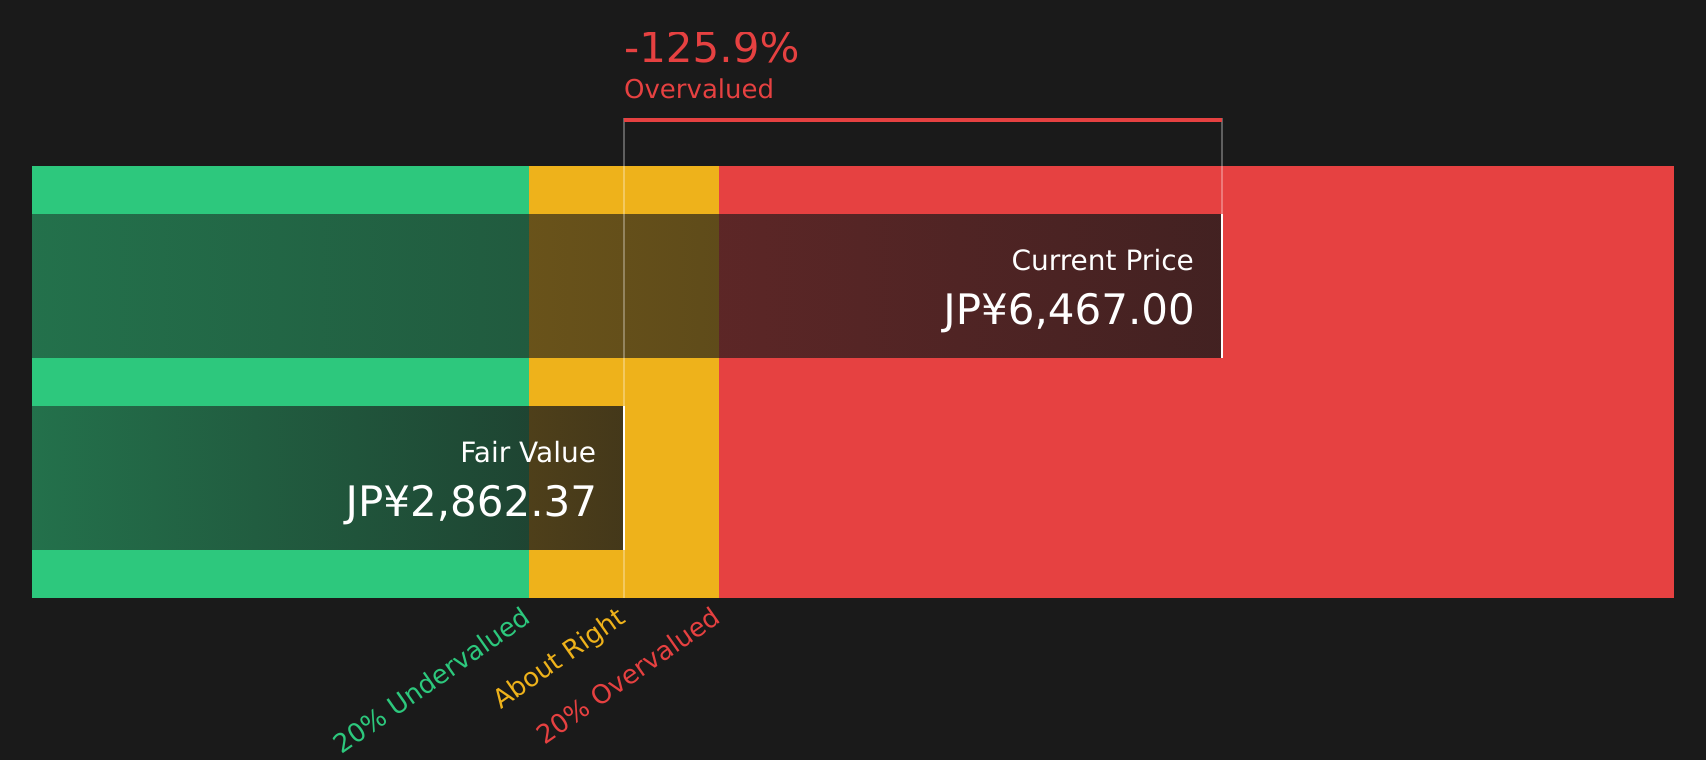
Our DCF model paints a very different picture, with an estimated future cash flow value of ¥2,862.37 per share versus the current ¥6,448 price. That gap suggests Osaka Gas screens as overvalued on this method. Which signal do you consider more informative: earnings today or cash flows tomorrow?
Look into how the SWS DCF model arrives at its fair value.
 9532 Discounted Cash Flow as at Feb 2026
Simply Wall St performs a discounted cash flow (DCF) on every stock in the world every day (check out Osaka Gas for example). We show the entire calculation in full. You can track the result in your watchlist or portfolio and be alerted when this changes, or use our stock screener to discover 18 high quality undervalued stocks. If you save a screener we even alert you when new companies match – so you never miss a potential opportunity.
Next Steps
If this mix of signals feels mixed to you, that is the point. Now is a good moment to look through the key risks and rewards yourself and weigh up 3 key rewards and 1 important warning sign.
Looking for more investment ideas?
If Osaka Gas has sharpened your focus, do not stop here. Use the Simply Wall St Screener to quickly surface other opportunities that could fit your checklist.
This article by Simply Wall St is general in nature. We provide commentary based on historical data
and analyst forecasts only using an unbiased methodology and our articles are not intended to be financial advice. It does not constitute a recommendation to buy or sell any stock, and does not take account of your objectives, or your
financial situation. We aim to bring you long-term focused analysis driven by fundamental data.
Note that our analysis may not factor in the latest price-sensitive company announcements or qualitative material.
Simply Wall St has no position in any stocks mentioned.
New: AI Stock Screener & Alerts
Our new AI Stock Screener scans the market every day to uncover opportunities.
• Dividend Powerhouses (3%+ Yield)
• Undervalued Small Caps with Insider Buying
• High growth Tech and AI Companies
Or build your own from over 50 metrics.
Explore Now for Free
Have feedback on this article? Concerned about the content? Get in touch with us directly. Alternatively, email editorial-team@simplywallst.com
AloJapan.com