

Feb 23, 2026
IndexBox has just published a new report: Japan – Frozen Atlantic Salmon And Danube Salmon – Market Analysis, Forecast, Size, Trends And Insights.
This article provides a comprehensive analysis of Japan’s market for frozen Atlantic and Danube salmon. It details a sharp decline in consumption and imports for 2024, with consumption falling to 868 tons and imports to 883 tons. Despite this recent contraction, the long-term forecast to 2035 remains positive, with the market expected to grow to 1.4K tons in volume and $14M in value. Norway is the dominant import supplier, while Malaysia is the primary export destination. The report also covers significant changes in import and export prices, highlighting the market’s evolving value dynamics.
Key Findings
Market forecast to grow to 1.4K tons ($14M) by 2035 despite a sharp 2024 decline2024 consumption and imports fell rapidly by -36.9% and -45.5% respectivelyNorway is the leading import source, supplying 64% of Japan’s volumeAverage import price rose 19% in 2024, reaching $8,865 per tonExports collapsed by -93.8% in 2024, with Malaysia as the main destinationMarket Forecast
Driven by increasing demand for frozen atlantic salmon and danube salmon in Japan, the market is expected to continue an upward consumption trend over the next decade. Market performance is forecast to decelerate, expanding with an anticipated CAGR of +4.5% for the period from 2024 to 2035, which is projected to bring the market volume to 1.4K tons by the end of 2035.
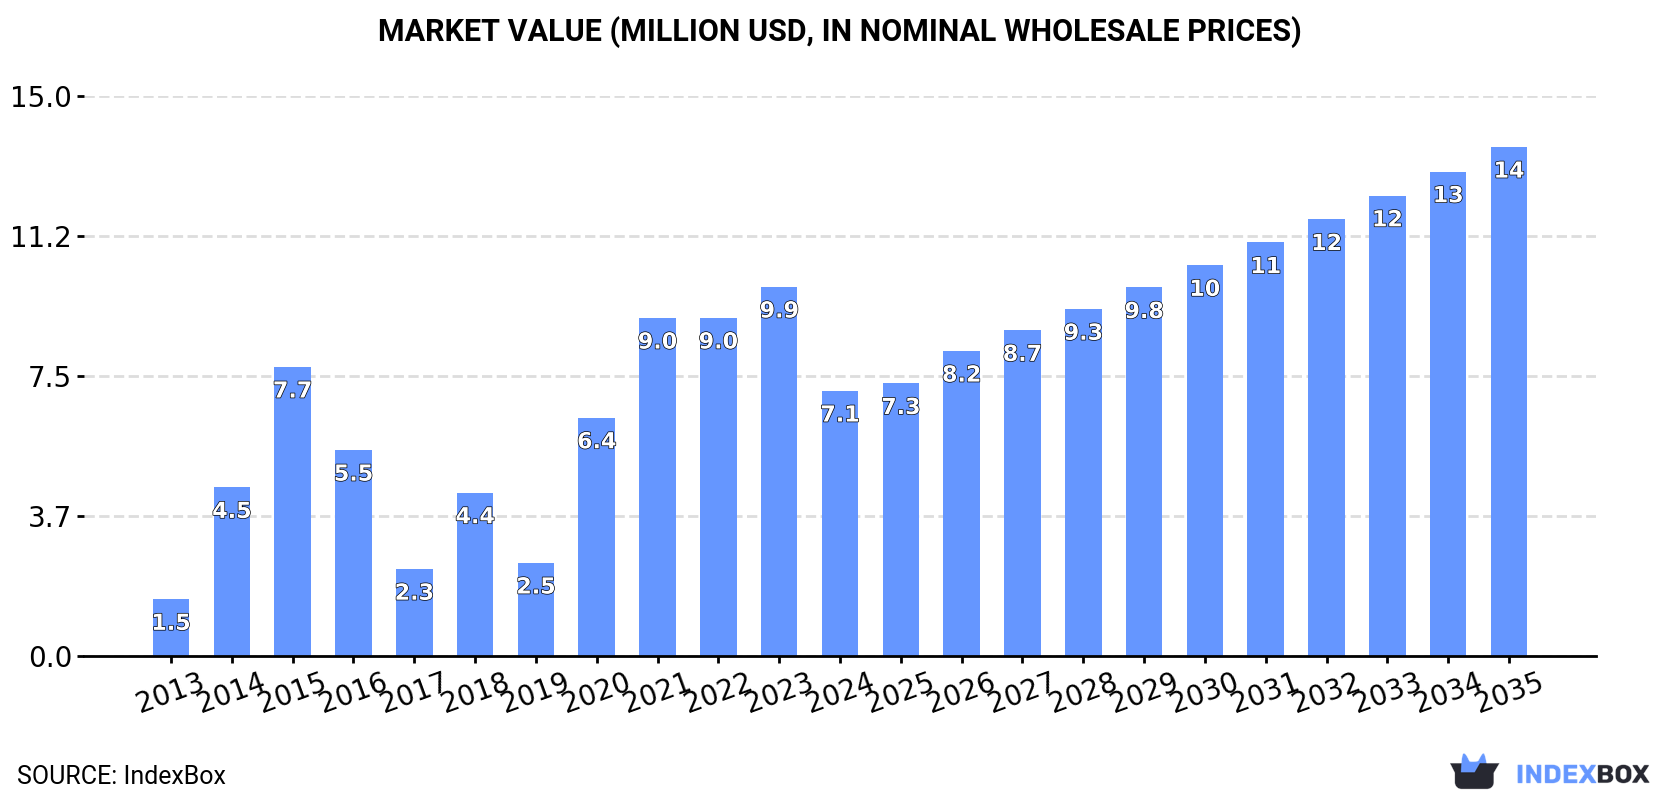
In value terms, the market is forecast to increase with an anticipated CAGR of +6.1% for the period from 2024 to 2035, which is projected to bring the market value to $14M (in nominal wholesale prices) by the end of 2035.
 ConsumptionJapan’s Consumption of Frozen Atlantic Salmon And Danube Salmon
In 2024, the amount of frozen atlantic salmon and danube salmon consumed in Japan declined rapidly to 868 tons, which is down by -36.9% on the previous year. Overall, consumption, however, showed strong growth. Consumption of peaked at 1.4K tons in 2021; however, from 2022 to 2024, consumption stood at a somewhat lower figure.
The revenue of the market for frozen atlantic salmon and danube salmon in Japan reduced rapidly to $7.1M in 2024, with a decrease of -28.2% against the previous year. This figure reflects the total revenues of producers and importers (excluding logistics costs, retail marketing costs, and retailers’ margins, which will be included in the final consumer price). Over the period under review, consumption, however, enjoyed a prominent increase. Consumption of peaked at $9.9M in 2023, and then contracted rapidly in the following year.
ImportsJapan’s Imports of Frozen Atlantic Salmon And Danube Salmon
In 2024, imports of frozen atlantic salmon and danube salmon into Japan dropped dramatically to 883 tons, which is down by -45.5% compared with the previous year’s figure. In general, imports recorded a perceptible decline. The pace of growth appeared the most rapid in 2020 with an increase of 121% against the previous year. Imports peaked at 1.9K tons in 2014; however, from 2015 to 2024, imports failed to regain momentum.
In value terms, imports of frozen atlantic salmon and danube salmon contracted rapidly to $7.8M in 2024. Overall, imports recorded a slight contraction. The growth pace was the most rapid in 2020 with an increase of 55% against the previous year. Over the period under review, imports of reached the peak figure at $12M in 2023, and then reduced notably in the following year.
Imports By Country
In 2024, Norway (565 tons) constituted the largest supplier of frozen atlantic salmon and danube salmon to Japan, with a 64% share of total imports. Moreover, imports of frozen atlantic salmon and danube salmon from Norway exceeded the figures recorded by the second-largest supplier, Faroe Islands (136 tons), fourfold. Chile (83 tons) ranked third in terms of total imports with a 9.4% share.
From 2013 to 2024, the average annual rate of growth in terms of volume from Norway totaled +1.1%. The remaining supplying countries recorded the following average annual rates of imports growth: Faroe Islands (-8.2% per year) and Chile (-13.2% per year).
In value terms, Norway ($5.3M) constituted the largest supplier of frozen atlantic salmon and danube salmon to Japan, comprising 67% of total imports. The second position in the ranking was taken by Faroe Islands ($1.2M), with a 15% share of total imports. It was followed by Chile, with a 7.6% share.
From 2013 to 2024, the average annual rate of growth in terms of value from Norway stood at +3.0%. The remaining supplying countries recorded the following average annual rates of imports growth: Faroe Islands (-5.4% per year) and Chile (-9.2% per year).
Import Prices By Country
The average import price for frozen atlantic salmon and danube salmon stood at $8,865 per ton in 2024, picking up by 19% against the previous year. Overall, import price indicated moderate growth from 2013 to 2024: its price increased at an average annual rate of +3.0% over the last eleven-year period. The trend pattern, however, indicated some noticeable fluctuations being recorded throughout the analyzed period. Based on 2024 figures, import price for frozen atlantic salmon and danube salmon increased by +83.4% against 2020 indices. The most prominent rate of growth was recorded in 2021 an increase of 36% against the previous year. The import price peaked in 2024 and is likely to continue growth in the near future.
There were significant differences in the average prices amongst the major supplying countries. In 2024, amid the top importers, the country with the highest price was Canada ($17,279 per ton), while the price for Iceland ($6,269 per ton) was amongst the lowest.
From 2013 to 2024, the most notable rate of growth in terms of prices was attained by Chile (+4.6%), while the prices for the other major suppliers experienced more modest paces of growth.
ExportsJapan’s Exports of Frozen Atlantic Salmon And Danube Salmon
In 2024, overseas shipments of frozen atlantic salmon and danube salmon decreased by -93.8% to 15 tons for the first time since 2021, thus ending a two-year rising trend. In general, exports continue to indicate a dramatic curtailment. The most prominent rate of growth was recorded in 2017 with an increase of 403% against the previous year. Over the period under review, the exports of hit record highs at 1.2K tons in 2014; however, from 2015 to 2024, the exports stood at a somewhat lower figure.
In value terms, exports of frozen atlantic salmon and danube salmon contracted remarkably to $133K in 2024. Overall, exports recorded a precipitous shrinkage. The pace of growth was the most pronounced in 2023 when exports increased by 61%. Over the period under review, the exports of reached the maximum at $2.9M in 2016; however, from 2017 to 2024, the exports stood at a somewhat lower figure.
Exports By Country
Malaysia (13 tons) was the main destination for exports of frozen atlantic salmon and danube salmon from Japan, accounting for a 84% share of total exports. Moreover, exports of frozen atlantic salmon and danube salmon to Malaysia exceeded the volume sent to the second major destination, Hong Kong SAR (2.4 tons), fivefold.
From 2013 to 2024, the average annual rate of growth in terms of volume to Malaysia stood at +3.6%.
In value terms, Malaysia ($100K) emerged as the key foreign market for frozen atlantic salmon and danube salmon exports from Japan, comprising 75% of total exports. The second position in the ranking was held by Hong Kong SAR ($33K), with a 25% share of total exports.
From 2013 to 2024, the average annual growth rate of value to Malaysia was relatively modest.
Export Prices By Country
In 2024, the average export price for frozen atlantic salmon and danube salmon amounted to $8,779 per ton, flattening at the previous year. Over the period under review, the export price posted a prominent expansion. The most prominent rate of growth was recorded in 2015 an increase of 1,264% against the previous year. As a result, the export price attained the peak level of $23,526 per ton. From 2016 to 2024, the average export prices failed to regain momentum.
Prices varied noticeably by country of destination: amid the top suppliers, the country with the highest price was Hong Kong SAR ($14,081 per ton), while the average price for exports to Malaysia stood at $7,844 per ton.
From 2013 to 2024, the most notable rate of growth in terms of prices was recorded for supplies to Vietnam (+16.6%), while the prices for the other major destinations experienced more modest paces of growth.
Source: IndexBox Market Intelligence Platform
This report provides a comprehensive view of the frozen atlantic salmon and danube salmon industry in Japan, tracking demand, supply, and trade flows across the national value chain. It explains how demand across key channels and end-use segments shapes consumption patterns, while also mapping the role of input availability, production efficiency, and regulatory standards on supply.
Beyond headline metrics, the study benchmarks prices, margins, and trade routes so you can see where value is created and how it moves between domestic suppliers and international partners. The analysis is designed to support strategic planning, market entry, portfolio prioritization, and risk management in the frozen atlantic salmon and danube salmon landscape in Japan.
Quick navigation
Key findings
Domestic demand is shaped by both household and industrial usage, with trade flows linking local supply to imports and exports.
Pricing dynamics reflect unit values, freight costs, exchange rates, and regulatory shifts that affect sourcing decisions.
Supply depends on input availability and production efficiency, creating a distinct national cost curve.
Market concentration varies by segment, creating different competitive landscapes and entry barriers.
The 2035 outlook highlights where capacity investment and demand growth are most aligned within the country.
Report scope
The report combines market sizing with trade intelligence and price analytics for Japan. It covers both historical performance and the forward outlook to 2035, allowing you to compare cycles, structural shifts, and policy impacts.
Market size and growth in value and volume terms
Consumption structure by end-use segments
Production capacity, output, and cost dynamics
Trade flows, exporters, importers, and balances
Price benchmarks, unit values, and margin signals
Competitive context and market entry conditions
Product coverageFrozen Atlantic Salmon And Danube SalmonCountry coverageCountry profile and benchmarks
This report provides a consistent view of market size, trade balance, prices, and per-capita indicators for Japan. The profile highlights demand structure and trade position, enabling benchmarking against regional and global peers.
Methodology
The analysis is built on a multi-source framework that combines official statistics, trade records, company disclosures, and expert validation. Data are standardized, reconciled, and cross-checked to ensure consistency across time series.
International trade data (exports, imports, and mirror statistics)
National production and consumption statistics
Company-level information from financial filings and public releases
Price series and unit value benchmarks
Analyst review, outlier checks, and time-series validation
All data are normalized to a common product definition and mapped to a consistent set of codes. This ensures that comparisons across time are aligned and actionable.
Forecasts to 2035
The forecast horizon extends to 2035 and is based on a structured model that links frozen atlantic salmon and danube salmon demand and supply to macroeconomic indicators, trade patterns, and sector-specific drivers. The model captures both cyclical and structural factors and reflects known policy and technology shifts in Japan.
Historical baseline: 2012-2025
Forecast horizon: 2026-2035
Scenario-based sensitivity to income growth, substitution, and regulation
Capacity and investment outlook for major producing companies
Each projection is built from national historical patterns and the broader regional context, allowing the report to show where growth is concentrated and where risks are elevated.
Price analysis and trade dynamics
Prices are analyzed in detail, including export and import unit values, regional spreads, and changes in trade costs. The report highlights how seasonality, freight rates, exchange rates, and supply disruptions influence pricing and margins.
Price benchmarks by country and sub-region
Export and import unit value trends
Seasonality and calendar effects in trade flows
Price outlook to 2035 under baseline assumptions
Profiles of market participants
Key producers, exporters, and distributors are profiled with a focus on their operational scale, geographic footprint, product mix, and market positioning. This helps identify competitive pressure points, partnership opportunities, and routes to differentiation.
Business focus and production capabilities
Geographic reach and distribution networks
Cost structure and pricing strategy indicators
Compliance, certification, and sustainability context
How to use this report
Quantify domestic demand and identify the most attractive segments
Evaluate export opportunities and prioritize target destinations
Track price dynamics and protect margins
Benchmark performance against leading competitors
Build evidence-based forecasts for investment decisions
This report is designed for manufacturers, distributors, importers, wholesalers, investors, and advisors who need a clear, data-driven picture of frozen atlantic salmon and danube salmon dynamics in Japan.
FAQ
What is included in the frozen atlantic salmon and danube salmon market in Japan?
The market size aggregates consumption and trade data, presented in both value and volume terms.
How are the forecasts to 2035 built?
The projections combine historical trends with macroeconomic indicators, trade dynamics, and sector-specific drivers.
Does the report cover prices and margins?
Yes, it includes export and import unit values, regional spreads, and a pricing outlook to 2035.
Which benchmarks are included?
The report benchmarks market size, trade balance, prices, and per-capita indicators for Japan.
Can this report support market entry decisions?
Yes, it highlights demand hotspots, trade routes, pricing trends, and competitive context.
1. INTRODUCTION
Making Data-Driven Decisions to Grow Your Business
REPORT DESCRIPTION
RESEARCH METHODOLOGY AND THE AI PLATFORM
DATA-DRIVEN DECISIONS FOR YOUR BUSINESS
GLOSSARY AND SPECIFIC TERMS
2. EXECUTIVE SUMMARY
A Quick Overview of Market Performance
KEY FINDINGS
MARKET TRENDSThis Chapter is Available Only for the Professional EditionPRO
3. MARKET OVERVIEW
Understanding the Current State of The Market and its Prospects
MARKET SIZE: HISTORICAL DATA (2012–2025) AND FORECAST (2026–2035)
MARKET STRUCTURE: HISTORICAL DATA (2012–2025) AND FORECAST (2026–2035)
TRADE BALANCE: HISTORICAL DATA (2012–2025) AND FORECAST (2026–2035)
PER CAPITA CONSUMPTION: HISTORICAL DATA (2012–2025) AND FORECAST (2026–2035)
MARKET FORECAST TO 2035
4. MOST PROMISING PRODUCTS FOR DIVERSIFICATION
Finding New Products to Diversify Your Business
TOP PRODUCTS TO DIVERSIFY YOUR BUSINESS
BEST-SELLING PRODUCTS
MOST CONSUMED PRODUCTS
MOST TRADED PRODUCTS
MOST PROFITABLE PRODUCTS FOR EXPORTS
5. MOST PROMISING SUPPLYING COUNTRIES
Choosing the Best Countries to Establish Your Sustainable Supply Chain
TOP COUNTRIES TO SOURCE YOUR PRODUCT
TOP PRODUCING COUNTRIES
TOP EXPORTING COUNTRIES
LOW-COST EXPORTING COUNTRIES
6. MOST PROMISING OVERSEAS MARKETS
Choosing the Best Countries to Boost Your Export
TOP OVERSEAS MARKETS FOR EXPORTING YOUR PRODUCT
TOP CONSUMING MARKETS
UNSATURATED MARKETS
TOP IMPORTING MARKETS
MOST PROFITABLE MARKETS
7. PRODUCTION
The Latest Trends and Insights into The Industry
PRODUCTION VOLUME AND VALUE: HISTORICAL DATA (2012–2025) AND FORECAST (2026–2035)
8. IMPORTS
The Largest Import Supplying Countries
IMPORTS: HISTORICAL DATA (2012–2025) AND FORECAST (2026–2035)
IMPORTS BY COUNTRY: HISTORICAL DATA (2012–2025)
IMPORT PRICES BY COUNTRY: HISTORICAL DATA (2012–2025)
9. EXPORTS
The Largest Destinations for Exports
EXPORTS: HISTORICAL DATA (2012–2025) AND FORECAST (2026–2035)
EXPORTS BY COUNTRY: HISTORICAL DATA (2012–2025)
EXPORT PRICES BY COUNTRY: HISTORICAL DATA (2012–2025)
10. PROFILES OF MAJOR PRODUCERS
The Largest Producers on The Market and Their Profiles
LIST OF TABLES
Key Findings In 2025
Market Volume, In Physical Terms: Historical Data (2012–2025) and Forecast (2026–2035)
Market Value: Historical Data (2012–2025) and Forecast (2026–2035)
Per Capita Consumption: Historical Data (2012–2025) and Forecast (2026–2035)
Imports, In Physical Terms, By Country, 2012–2025
Imports, In Value Terms, By Country, 2012–2025
Import Prices, By Country, 2012–2025
Exports, In Physical Terms, By Country, 2012–2025
Exports, In Value Terms, By Country, 2012–2025
Export Prices, By Country, 2012–2025
LIST OF FIGURES
Market Volume, In Physical Terms: Historical Data (2012–2025) and Forecast (2026–2035)
Market Value: Historical Data (2012–2025) and Forecast (2026–2035)
Market Structure – Domestic Supply vs. Imports, in Physical Terms: Historical Data (2012–2025) and Forecast (2026–2035)
Market Structure – Domestic Supply vs. Imports, in Value Terms: Historical Data (2012–2025) and Forecast (2026–2035)
Trade Balance, In Physical Terms: Historical Data (2012–2025) and Forecast (2026–2035)
Trade Balance, In Value Terms: Historical Data (2012–2025) and Forecast (2026–2035)
Per Capita Consumption: Historical Data (2012–2025) and Forecast (2026–2035)
Market Volume Forecast to 2035
Market Value Forecast to 2035
Market Size and Growth, By Product
Average Per Capita Consumption, By Product
Exports and Growth, By Product
Export Prices and Growth, By Product
Production Volume and Growth
Exports and Growth
Export Prices and Growth
Market Size and Growth
Per Capita Consumption
Imports and Growth
Import Prices
Production, In Physical Terms: Historical Data (2012–2025) and Forecast (2026–2035)
Production, In Value Terms: Historical Data (2012–2025) and Forecast (2026–2035)
Imports, In Physical Terms: Historical Data (2012–2025) and Forecast (2026–2035)
Imports, In Value Terms: Historical Data (2012–2025) and Forecast (2026–2035)
Imports, In Physical Terms, By Country, 2025
Imports, In Physical Terms, By Country, 2012–2025
Imports, In Value Terms, By Country, 2012–2025
Import Prices, By Country, 2012–2025
Exports, In Physical Terms: Historical Data (2012–2025) and Forecast (2026–2035)
Exports, In Value Terms: Historical Data (2012–2025) and Forecast (2026–2035)
Exports, In Physical Terms, By Country, 2025
Exports, In Physical Terms, By Country, 2012–2025
Exports, In Value Terms, By Country, 2012–2025
Export Prices, By Country, 2012–2025
AloJapan.com