
 Margin Compression Challenges Bullish Long Term Earnings Narrative")
Nakano (TSE:1827) has just posted its Q3 2026 numbers, with the latest available quarter showing revenue of ¥31.7 billion and EPS of ¥43.48, backed by net income of ¥1,494 million. The company has seen revenue move from ¥27.9 billion in Q3 2025 to ¥31.7 billion in Q2 2026, while EPS shifted from ¥31.78 to ¥43.48 over the same periods, giving investors a clear view of how the top and bottom lines are tracking into this year. With a trailing net profit margin of 2.8% compared to 3.4% last year, the focus now is on how efficiently Nakano can turn this revenue base into sustained profitability.
See our full analysis for Nakano.
With the headline numbers set, the next step is to see how this latest earnings run rate lines up with the most widely held narratives about Nakano, and where those stories might need updating.
Curious how numbers become stories that shape markets? Explore Community Narratives
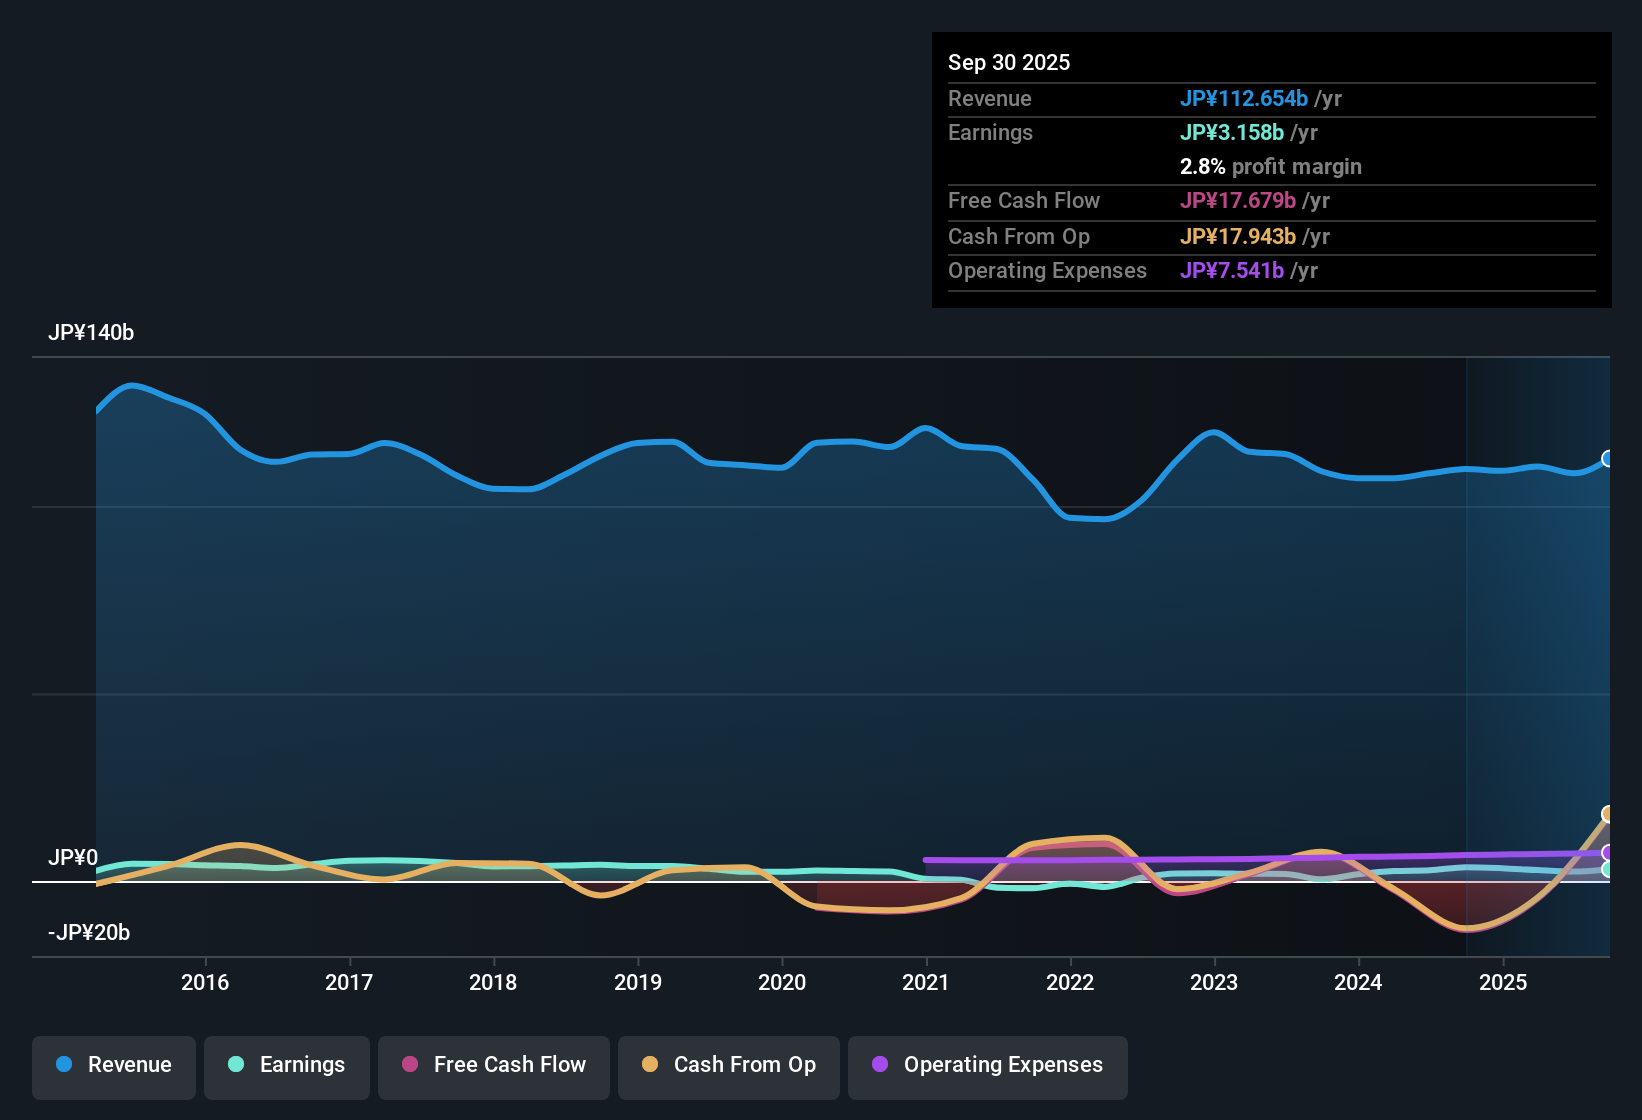 TSE:1827 Earnings & Revenue History as at Feb 2026 Trailing earnings soften despite strong five year record Over the last 12 months, net income was ¥3,158 million with a 2.8% net margin, compared with a 3.4% margin in the prior year, while the long term data shows five year earnings growth averaged 49.2% per year. What stands out for a bullish view is that the weaker trailing margin and negative year on year earnings growth sit alongside a long stretch of strong multi year earnings expansion, which means:
Supporters can point to the five year 49.2% annual earnings growth as evidence the business has previously grown profit faster than the most recent 12 month numbers suggest. On the other hand, the drop in net margin from 3.4% to 2.8% gives cautious investors a clear data point to question how easily that past record can be matched if profitability stays at this level.
Bulls and skeptics are both watching how this margin picture evolves against that strong five year growth story. Together, these figures help show how the current results relate to longer term expectations. 📊 Read the full Nakano Consensus Narrative.
Profitability intact but under more pressure The latest single quarter in the dataset shows Q2 2026 revenue of ¥31,661 million and net income of ¥1,494 million, while on a trailing 12 month basis profit sits at ¥3,158 million and the margin at 2.8%. Critics highlight that the lower trailing margin and year on year earnings decline can weigh on confidence in the business, and the data here gives them some backing and some pushback at the same time:
The 2.8% margin, down from 3.4%, aligns with the cautious view that cost pressure or pricing could be limiting how much profit Nakano keeps from its revenue base. At the same time, the company is still profitable in absolute terms, with more than ¥3,000 million of trailing net income and Q2 2026 EPS of ¥43.48, so the bearish angle is about the level of profitability, not a move into losses. Valuation and volatility send mixed signals The shares trade at ¥1,601 with a trailing P/E of 17.4x, above the 13.7x JP Construction industry average but close to the 17.5x peer average. The DCF fair value is given as ¥9,315.29 and the stock price has been volatile over the last three months. What is interesting for both bullish and bearish narratives is how this valuation data pushes in different directions at the same time:
The DCF fair value of ¥9,315.29 compared with the ¥1,601 share price shows the stock trading well below that model, which some investors may view as supporting a more optimistic stance despite softer trailing earnings. In contrast, the 17.4x P/E, which is richer than the broader industry, together with recent share price volatility and the weaker 2.8% margin, gives cautious investors numerical reasons to question how quickly the earnings trend might improve. Next Steps
Don’t just look at this quarter; the real story is in the long-term trend. We’ve done an in-depth analysis on Nakano’s growth and its valuation to see if today’s price is a bargain. Add the company to your watchlist or portfolio now so you don’t miss the next big move.
See What Else Is Out There
Nakano’s softer 2.8% net margin, year on year earnings decline and relatively rich 17.4x P/E highlight pressure on profitability and questions around value for the risk you take.
If that mix of thinner margins and a higher earnings multiple worries you, it is worth checking our 47 resilient stocks with low risk scores to find companies where earnings quality and risk scores may feel more comfortable.
This article by Simply Wall St is general in nature. We provide commentary based on historical data
and analyst forecasts only using an unbiased methodology and our articles are not intended to be financial advice. It does not constitute a recommendation to buy or sell any stock, and does not take account of your objectives, or your
financial situation. We aim to bring you long-term focused analysis driven by fundamental data.
Note that our analysis may not factor in the latest price-sensitive company announcements or qualitative material.
Simply Wall St has no position in any stocks mentioned.
Valuation is complex, but we’re here to simplify it.
Discover if Nakano might be undervalued or overvalued with our detailed analysis, featuring fair value estimates, potential risks, dividends, insider trades, and its financial condition.
Access Free Analysis
Have feedback on this article? Concerned about the content? Get in touch with us directly. Alternatively, email editorial-team@simplywallst.com
AloJapan.com