

OSAKA Titanium technologiesLtd (TSE:5726) has posted its Q3 2026 numbers, with revenue of ¥10.4b and basic EPS of ¥24.05, alongside net income excluding extra items of ¥885m. These figures help frame how you might think about the rest of the fiscal year. Over recent quarters the company has seen revenue move between ¥14.8b in Q2 2026, ¥12.1b in Q1 2026 and ¥11.0b in Q4 2025. Over the same period, basic EPS has ranged from ¥63.07 to ¥5.27, giving you a clearer view of how the top line and EPS have been tracking into this latest result. With that backdrop, attention now turns to how margins and profitability trends shape the risk and reward trade off around these fresh numbers.
See our full analysis for OSAKA Titanium technologiesLtd.
With the headline figures on the table, the next step is to see how they compare with the widely followed growth and risk narratives around OSAKA Titanium technologiesLtd, and how those narratives may be reinforced or challenged by the latest quarter.
Curious how numbers become stories that shape markets? Explore Community Narratives
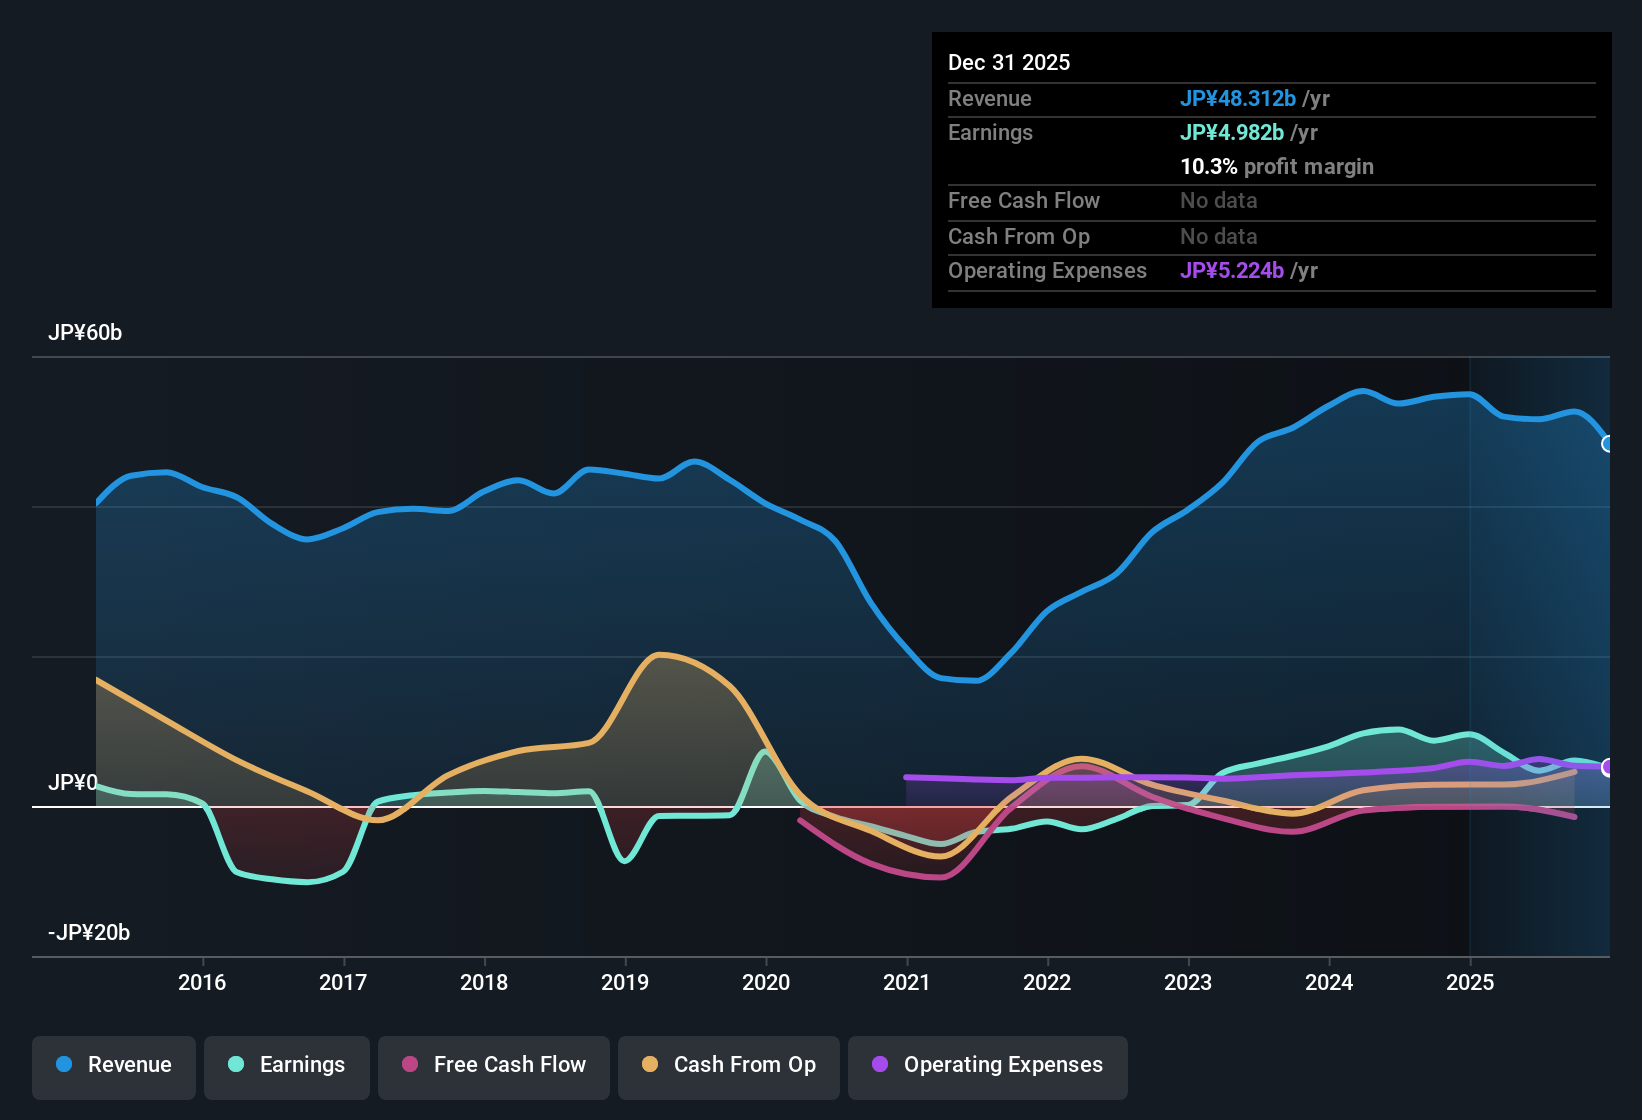 TSE:5726 Earnings & Revenue History as at Feb 2026 Trailing Revenue Near ¥48.3b With Softer Margins Over the last 12 months, OSAKA Titanium technologiesLtd generated about ¥48,312 million in revenue with net income excluding extra items of ¥4,982 million, giving a net margin of 10.3% compared with 17.4% a year earlier. Supporters of a more bullish view point to the earnings growth track record and forecasts, yet the margin picture adds some friction to that story:
Earnings are reported as having grown about 55.4% per year over the past five years and are forecast to grow around 21.9% per year, while revenue is forecast at roughly 9.3% per year, so the longer term and forward numbers sit above the Japan market forecasts cited. At the same time, the move from a 17.4% net margin last year to 10.3% over the latest 12 months means the growth angle sits alongside a thinner profitability profile. Bullish investors would want to keep this in mind when they look at those higher growth rates. DCF Fair Value Far Above ¥2,750 Share Price The shares trade at ¥2,750 compared with a DCF fair value estimate of ¥6,953.47. The trailing P/E of 20.3x sits above the Japan Metals & Mining industry average of 14x and below the peer average of 26.6x. What stands out for bullish investors is the gap to the DCF fair value and how that sits beside those relative valuation checks:
With the stock described as about 60.5% below the DCF fair value estimate, the valuation model suggests a wide difference between price and that fair value input, even though the P/E is not the cheapest in the industry sample. The mix of a higher than industry P/E and a large gap to DCF fair value means the growth and margin data, such as ¥4,982 million of net income over ¥48,312 million of revenue, are doing a lot of work in that bullish valuation case. On top of these numbers, if you want to see how different investors frame the bigger picture around growth, value and risk here, 📊 Read the full OSAKA Titanium technologiesLtd Consensus Narrative. can give you the full narrative context that sits behind views on this latest update.
Debt Cover And Volatile Share Price Stand Out Alongside these earnings and valuation inputs, two flagged watchpoints are that operating cash flow does not clearly cover debt and the share price has been more volatile than the broader Japan market over the past three months. Investors with a more cautious, almost bearish tilt often focus on how these risk items sit next to the growth and valuation story:
Debt coverage by operating cash flow being described as weak means that even with ¥4,982 million of net income over the last 12 months, the cash side of the business is an important area to track rather than just relying on accounting profit. The recent higher volatility in the share price relative to the Japan market can make that ¥2,750 entry point feel less stable. Anyone leaning into the growth forecasts of about 21.9% earnings and 9.3% revenue per year is doing so with these risk flags in view. Next Steps
Don’t just look at this quarter; the real story is in the long-term trend. We’ve done an in-depth analysis on OSAKA Titanium technologiesLtd’s growth and its valuation to see if today’s price is a bargain. Add the company to your watchlist or portfolio now so you don’t miss the next big move.
Explore Alternatives
OSAKA Titanium technologiesLtd combines thinner net margins, weaker debt coverage by operating cash flow and a more volatile share price, which may leave some investors uneasy.
If you want exposure to companies where balance sheets and cash coverage look tighter, check out our solid balance sheet and fundamentals stocks screener (33 results) and quickly compare options that may better fit your risk comfort.
This article by Simply Wall St is general in nature. We provide commentary based on historical data
and analyst forecasts only using an unbiased methodology and our articles are not intended to be financial advice. It does not constitute a recommendation to buy or sell any stock, and does not take account of your objectives, or your
financial situation. We aim to bring you long-term focused analysis driven by fundamental data.
Note that our analysis may not factor in the latest price-sensitive company announcements or qualitative material.
Simply Wall St has no position in any stocks mentioned.
New: AI Stock Screener & Alerts
Our new AI Stock Screener scans the market every day to uncover opportunities.
• Dividend Powerhouses (3%+ Yield)
• Undervalued Small Caps with Insider Buying
• High growth Tech and AI Companies
Or build your own from over 50 metrics.
Explore Now for Free
Have feedback on this article? Concerned about the content? Get in touch with us directly. Alternatively, email editorial-team@simplywallst.com
AloJapan.com