
 Can Manage Its Debt Responsibly")
The external fund manager backed by Berkshire Hathaway’s Charlie Munger, Li Lu, makes no bones about it when he says ‘The biggest investment risk is not the volatility of prices, but whether you will suffer a permanent loss of capital.’ When we think about how risky a company is, we always like to look at its use of debt, since debt overload can lead to ruin. Importantly, Osaka Soda Co., Ltd. (TSE:4046) does carry debt. But is this debt a concern to shareholders?
This technology could replace computers: discover the 20 stocks are working to make quantum computing a reality.
When Is Debt Dangerous?
Debt assists a business until the business has trouble paying it off, either with new capital or with free cash flow. Part and parcel of capitalism is the process of ‘creative destruction’ where failed businesses are mercilessly liquidated by their bankers. However, a more usual (but still expensive) situation is where a company must dilute shareholders at a cheap share price simply to get debt under control. Of course, the upside of debt is that it often represents cheap capital, especially when it replaces dilution in a company with the ability to reinvest at high rates of return. The first step when considering a company’s debt levels is to consider its cash and debt together.
What Is Osaka Soda’s Debt?
The image below, which you can click on for greater detail, shows that Osaka Soda had debt of JP¥7.17b at the end of September 2025, a reduction from JP¥7.66b over a year. However, it does have JP¥45.6b in cash offsetting this, leading to net cash of JP¥38.4b.
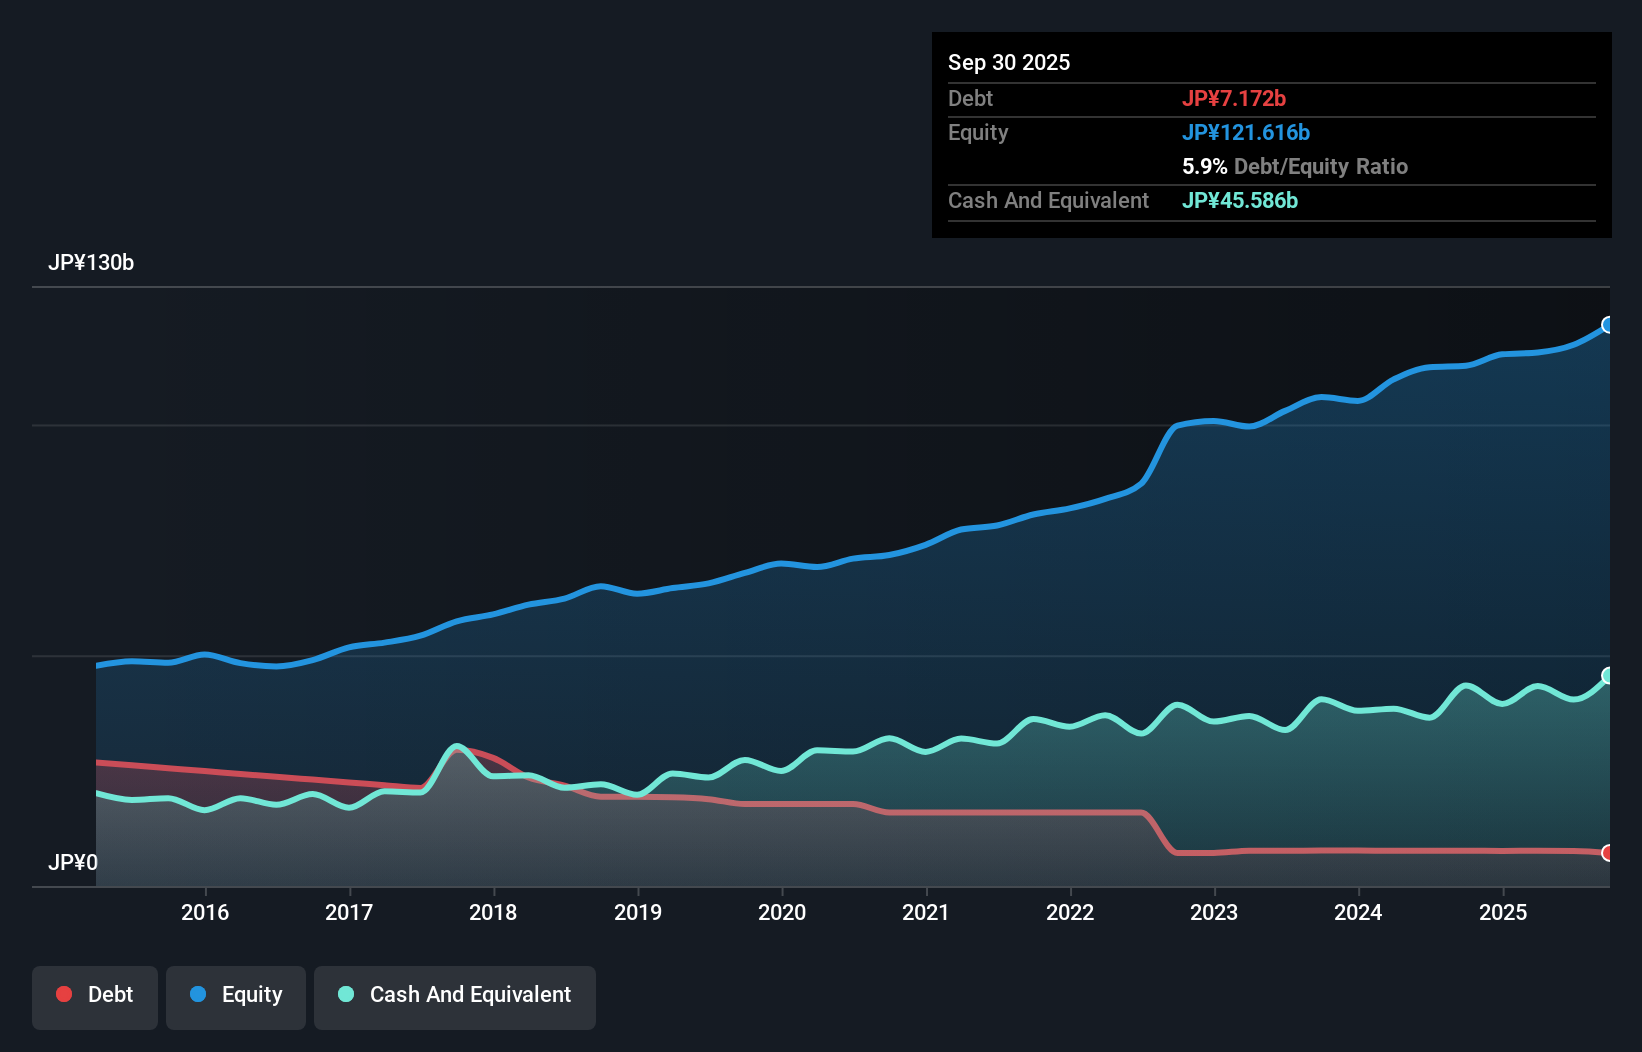 TSE:4046 Debt to Equity History February 7th 2026 How Healthy Is Osaka Soda’s Balance Sheet?
According to the last reported balance sheet, Osaka Soda had liabilities of JP¥30.1b due within 12 months, and liabilities of JP¥7.68b due beyond 12 months. On the other hand, it had cash of JP¥45.6b and JP¥30.6b worth of receivables due within a year. So it actually has JP¥38.4b more liquid assets than total liabilities.
This surplus suggests that Osaka Soda has a conservative balance sheet, and could probably eliminate its debt without much difficulty. Simply put, the fact that Osaka Soda has more cash than debt is arguably a good indication that it can manage its debt safely.
View our latest analysis for Osaka Soda
Also good is that Osaka Soda grew its EBIT at 15% over the last year, further increasing its ability to manage debt. The balance sheet is clearly the area to focus on when you are analysing debt. But it is future earnings, more than anything, that will determine Osaka Soda’s ability to maintain a healthy balance sheet going forward. So if you want to see what the professionals think, you might find this free report on analyst profit forecasts to be interesting.
Finally, a company can only pay off debt with cold hard cash, not accounting profits. While Osaka Soda has net cash on its balance sheet, it’s still worth taking a look at its ability to convert earnings before interest and tax (EBIT) to free cash flow, to help us understand how quickly it is building (or eroding) that cash balance. Looking at the most recent three years, Osaka Soda recorded free cash flow of 46% of its EBIT, which is weaker than we’d expect. That’s not great, when it comes to paying down debt.
Summing Up
While it is always sensible to investigate a company’s debt, in this case Osaka Soda has JP¥38.4b in net cash and a decent-looking balance sheet. On top of that, it increased its EBIT by 15% in the last twelve months. So is Osaka Soda’s debt a risk? It doesn’t seem so to us. The balance sheet is clearly the area to focus on when you are analysing debt. But ultimately, every company can contain risks that exist outside of the balance sheet. For example, we’ve discovered 1 warning sign for Osaka Soda that you should be aware of before investing here.
At the end of the day, it’s often better to focus on companies that are free from net debt. You can access our special list of such companies (all with a track record of profit growth). It’s free.
New: AI Stock Screener & Alerts
Our new AI Stock Screener scans the market every day to uncover opportunities.
• Dividend Powerhouses (3%+ Yield)
• Undervalued Small Caps with Insider Buying
• High growth Tech and AI Companies
Or build your own from over 50 metrics.
Explore Now for Free
Have feedback on this article? Concerned about the content? Get in touch with us directly. Alternatively, email editorial-team (at) simplywallst.com.
This article by Simply Wall St is general in nature. We provide commentary based on historical data and analyst forecasts only using an unbiased methodology and our articles are not intended to be financial advice. It does not constitute a recommendation to buy or sell any stock, and does not take account of your objectives, or your financial situation. We aim to bring you long-term focused analysis driven by fundamental data. Note that our analysis may not factor in the latest price-sensitive company announcements or qualitative material. Simply Wall St has no position in any stocks mentioned.
AloJapan.com