
 Valuation Check After Q3 2026 Earnings And Updated Full Year Guidance")
Osaka Gas (TSE:9532) is back in focus after its Q3 2026 earnings call on 2 February and its updated full-year guidance, with fresh figures giving investors clearer visibility on sales, profit and earnings per share.
See our latest analysis for Osaka Gas.
The earnings release and fresh guidance appear to have been a clear catalyst, with Osaka Gas delivering a 10.41% 7 day share price return and a 30.82% 90 day share price return, alongside a very large 5 year total shareholder return that suggests momentum has built over time.
If this earnings update has you looking beyond a single utility name, it could be a good moment to scan our 22 power grid technology and infrastructure stocks as a starting list of ideas tied to energy infrastructure trends.
So with the share price already up sharply and the stock trading above its average analyst price target, is Osaka Gas now looking stretched, or are investors still underestimating what the latest earnings and guidance could mean?
Preferred P/E of 13.5x: Is it justified?
On simple numbers, Osaka Gas trades on a P/E of 13.5x, with the last close at ¥6,397, which sits below both the Japan market average and the gas utilities peer group.
The P/E ratio compares the current share price to earnings per share, so it gives you a quick sense of how much investors are paying for each unit of profit. For a mature utilities name like Osaka Gas that already has sizeable earnings, P/E is often a go to yardstick for how the market is weighing stability, growth expectations and risk.
Here, Osaka Gas screens as cheaper than the broader Japan market, where the average P/E is 15x, and also below the Asian gas utilities industry average of 14.5x. However, when you compare that 13.5x to an estimated fair P/E of 9.7x, the current multiple looks richer than the level our fair ratio model suggests the market could gravitate toward if sentiment or growth expectations cool from here.
Explore the SWS fair ratio for Osaka Gas
Result: Price-to-Earnings of 13.5x (OVERVALUED)
However, you still need to weigh risks, such as an annual net income contraction of 4.8%, and the shares trading 11.3% above the average analyst price target.
Find out about the key risks to this Osaka Gas narrative.
Another view: cash flows paint a tougher picture
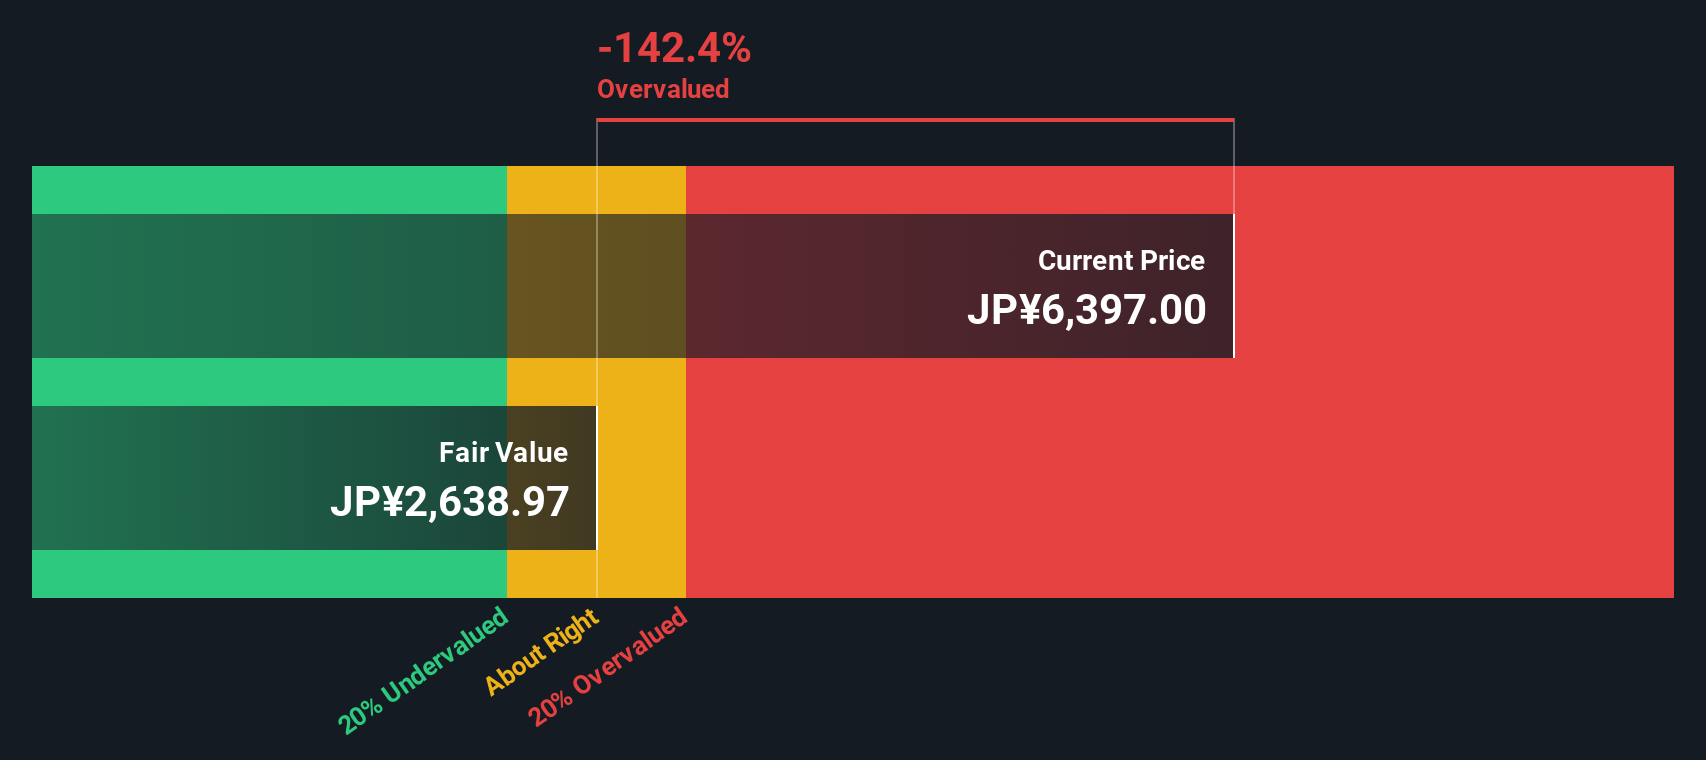
While the P/E of 13.5x makes Osaka Gas look cheaper than both the Japan market and the Asian gas utilities group, our DCF model points the other way. It estimates future cash flows at about ¥2,639 per share, well below the current ¥6,397 price, which flags potential valuation risk.
That kind of gap does not make DCF automatically right and earnings multiples wrong. However, it does push you to ask a simple question: are current buyers paying up for stability and recent profit growth, or assuming more than the cash flow outlook supports?
Look into how the SWS DCF model arrives at its fair value.
 9532 Discounted Cash Flow as at Feb 2026
Simply Wall St performs a discounted cash flow (DCF) on every stock in the world every day (check out Osaka Gas for example). We show the entire calculation in full. You can track the result in your watchlist or portfolio and be alerted when this changes, or use our stock screener to discover 25 high quality undervalued stocks. If you save a screener we even alert you when new companies match – so you never miss a potential opportunity.
Build Your Own Osaka Gas Narrative
If you see the data differently or would rather rely on your own work, you can test your assumptions and build a fresh Osaka Gas story in just a few minutes. Do it your way
A great starting point for your Osaka Gas research is our analysis highlighting 3 key rewards and 1 important warning sign that could impact your investment decision.
Ready to broaden your watchlist?
Once you have a view on Osaka Gas, do not stop there; your next strong idea could be sitting just outside your current watchlist.
This article by Simply Wall St is general in nature. We provide commentary based on historical data
and analyst forecasts only using an unbiased methodology and our articles are not intended to be financial advice. It does not constitute a recommendation to buy or sell any stock, and does not take account of your objectives, or your
financial situation. We aim to bring you long-term focused analysis driven by fundamental data.
Note that our analysis may not factor in the latest price-sensitive company announcements or qualitative material.
Simply Wall St has no position in any stocks mentioned.
New: AI Stock Screener & Alerts
Our new AI Stock Screener scans the market every day to uncover opportunities.
• Dividend Powerhouses (3%+ Yield)
• Undervalued Small Caps with Insider Buying
• High growth Tech and AI Companies
Or build your own from over 50 metrics.
Explore Now for Free
Have feedback on this article? Concerned about the content? Get in touch with us directly. Alternatively, email editorial-team@simplywallst.com
AloJapan.com