
 Margin Expansion Reinforces Bullish Narratives Despite Slower Growth Outlook")
Tokyo Metro (TSE:9023) has reported another solid quarter for Q3 2026, with revenue of ¥106.3b and basic EPS of ¥28.34. This is set against a trailing twelve month EPS of ¥108.73 and net income of ¥63.1b that has translated into a 28.7% earnings increase over the past year. The company has seen revenue move from ¥103.7b in Q3 2025 to ¥106.3b in Q3 2026 and quarterly EPS rise from ¥19.40 to ¥28.34, while trailing net margin has shifted from 12.1% to 15.1%. This gives investors a clearer view of how efficiently those fares are turning into profits. With that kind of margin profile now reported, attention turns to how durable this profitability mix appears as the story develops.
See our full analysis for Tokyo Metro.
With the latest numbers laid out, the next step is to see how this profit and margin picture lines up with the widely followed narratives around Tokyo Metro, and where the figures might be telling a different story.
Curious how numbers become stories that shape markets? Explore Community Narratives
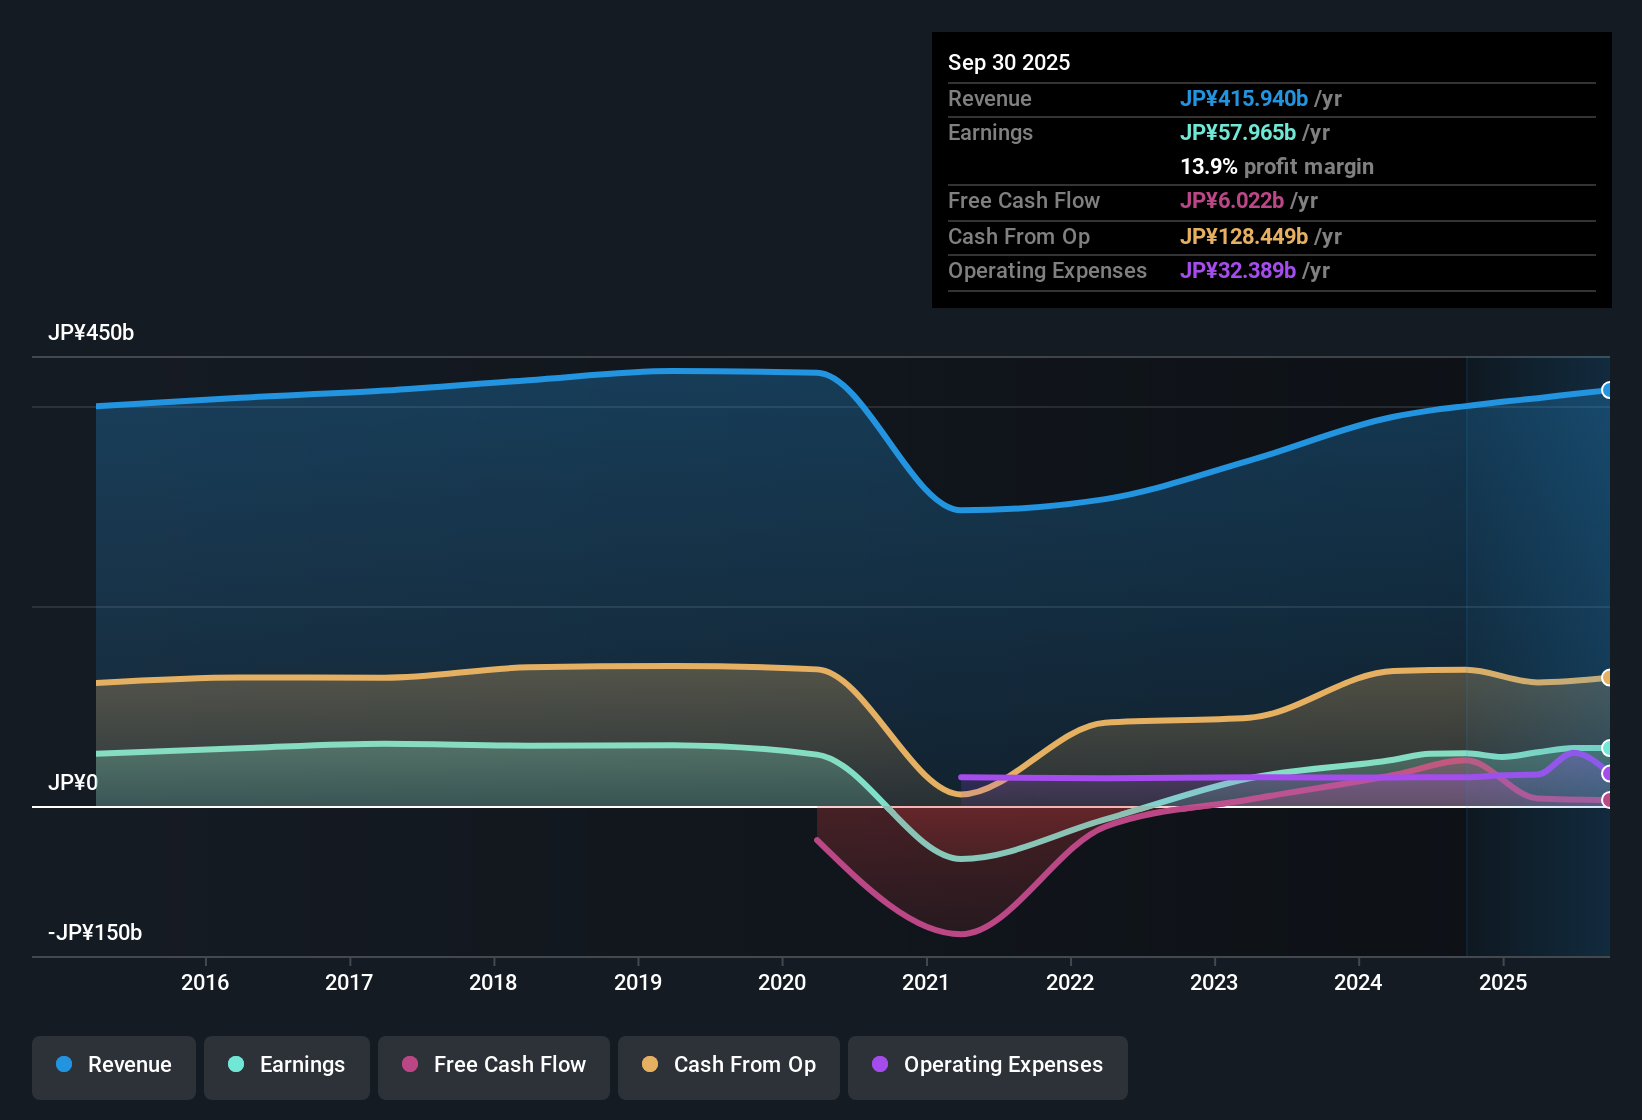 TSE:9023 Earnings & Revenue History as at Jan 2026 28.7% profit growth backed by higher margins Over the last 12 months, net income reached ¥63.1b with earnings up 28.7% and net margin at 15.1% compared with 12.1% a year earlier, so more of every ¥ of the ¥418.5b in trailing revenue is now showing up as profit. Bulls often focus on this combination of 28.7% earnings growth and a 5 year earnings growth rate of about 48% per year. However, it sits alongside revenue growth forecasts of 2.5% a year and almost flat earnings forecasts of 0.06% a year, which raises questions about how much of this strong margin profile can be repeated.
Supporters can point to the step up in quarterly net income from ¥11.3b in Q3 2025 to ¥16.5b in Q3 2026 as evidence of earnings power. Skeptics can point out that if revenue only grows around 2.5% a year while the wider market is at 5%, the recent 15.1% margin may be harder to maintain without more cost work. P/E premium against 12.4x industry Tokyo Metro trades on a trailing P/E of 15.2x versus about 12.4x for the wider JP Transportation industry and 10.4x for peers, so investors are paying a higher multiple for its ¥108.73 of trailing EPS at a share price of ¥1,652.5. Bears argue that this premium looks stretched when you put it next to slower expected growth and a DCF fair value of ¥602.89, and the numbers here give them some support.
The gap between the current share price of ¥1,652.5 and the DCF fair value of ¥602.89 is very large, while earnings forecasts of 0.06% a year sit far below the broader JP market at 9%. At the same time, revenue growth expectations of 2.5% a year versus the market at 5% suggest the business is not being priced as a low growth utility like some peers, which is exactly what critics point to when they question the P/E premium. A cautious market is already debating whether this 15.2x P/E and large gap to DCF fair value leave much room for error on future growth. 🐻 Tokyo Metro Bear Case Dividend appeal vs cash flow strain The stock currently offers a 2.54% dividend yield, but that payout is not well covered by free cash flow and operating cash flow does not comfortably cover debt, which puts more attention on the quality of the ¥63.1b of trailing net income. What stands out here is how a bullish focus on profit growth runs into the more cautious view around cash generation, and the risk side of the story leans heavily on these coverage gaps.
On the reward side, earnings have grown 28.7% over the last year and around 48% per year over 5 years, which can make the 2.54% yield look attractive at first glance. On the risk side, weak free cash flow coverage of that dividend and debt that is not well covered by operating cash flow mean income focused holders are relying on continued strong profits eventually flowing through into stronger cash metrics. Next Steps
Don’t just look at this quarter; the real story is in the long-term trend. We’ve done an in-depth analysis on Tokyo Metro’s growth and its valuation to see if today’s price is a bargain. Add the company to your watchlist or portfolio now so you don’t miss the next big move.
See What Else Is Out There
Tokyo Metro’s premium 15.2x P/E, large gap to the DCF fair value of ¥602.89, and modest revenue and earnings forecasts all highlight valuation pressure.
If that mix feels tight for your comfort, shift your attention to these 869 undervalued stocks based on cash flows to hunt for companies where pricing looks more aligned with their earnings power and future potential.
This article by Simply Wall St is general in nature. We provide commentary based on historical data
and analyst forecasts only using an unbiased methodology and our articles are not intended to be financial advice. It does not constitute a recommendation to buy or sell any stock, and does not take account of your objectives, or your
financial situation. We aim to bring you long-term focused analysis driven by fundamental data.
Note that our analysis may not factor in the latest price-sensitive company announcements or qualitative material.
Simply Wall St has no position in any stocks mentioned.
Valuation is complex, but we’re here to simplify it.
Discover if Tokyo Metro might be undervalued or overvalued with our detailed analysis, featuring fair value estimates, potential risks, dividends, insider trades, and its financial condition.
Access Free Analysis
Have feedback on this article? Concerned about the content? Get in touch with us directly. Alternatively, email editorial-team@simplywallst.com
AloJapan.com