
 Valuation Check After Strong Share Price Momentum")
Recent share performance
Osaka Gas (TSE:9532) has quietly drawn attention after a strong run in its shares, with recent returns over the past month and past 3 months prompting investors to reassess the utility’s profile.
See our latest analysis for Osaka Gas.
With the share price at ¥5,736 and a 90 day share price return of 28.67%, Osaka Gas sits on a much stronger footing than its 5.44% year to date share price return. The 1 year total shareholder return of 92.37% points to momentum that has been building over a longer stretch.
If Osaka Gas has you rethinking your watchlist, it could be a good moment to broaden your search and check out fast growing stocks with high insider ownership as potential next ideas.
With the stock at ¥5,736, a value score of 2, and revenue and net income growth both slightly in decline, it is worth asking: is Osaka Gas still undervalued, or is the market already pricing in future growth?
Preferred P/E of 12.4x: Is it justified?
At a last close of ¥5,736, Osaka Gas is trading on a P/E of 12.4x, which screens cheaper than several reference points but not against every yardstick.
The P/E multiple compares the current share price to earnings per share, so you are effectively seeing how much the market is paying for each unit of profit. For a gas utility with relatively mature operations, this is a common way investors size up whether current earnings look rich or reasonable.
On one hand, Osaka Gas screens as good value against multiple peer sets. Its 12.4x P/E is below the JP market at 14.9x, below the Asian Gas Utilities average at 14.5x, and below a closer peer group at 16.7x. On the other hand, our fair value work suggests a lower fair P/E of 9.2x, implying the current multiple sits above the level our regression based fair ratio points to as a potential anchor the market could move towards.
Explore the SWS fair ratio for Osaka Gas
Result: Price-to-Earnings of 12.4x (OVERVALUED)
However, softer revenue and net income growth, together with a P/E above the fair ratio estimate, could pressure sentiment if earnings or pricing assumptions are tested.
Find out about the key risks to this Osaka Gas narrative.
Another view on value
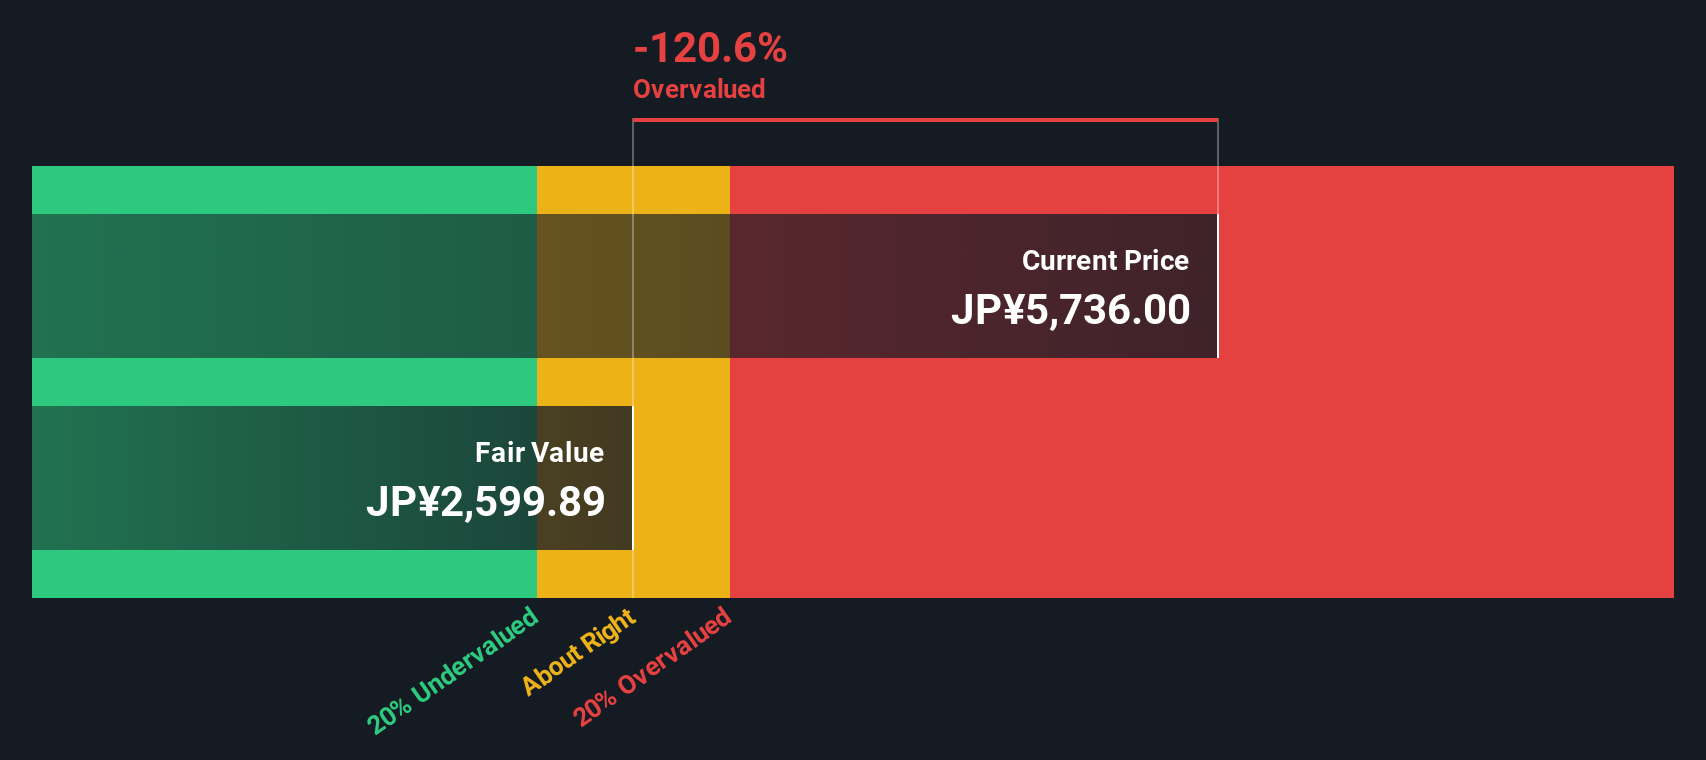
Our DCF model suggests a more conservative perspective. At ¥5,736, Osaka Gas is trading above an estimated future cash flow value of ¥2,599.89. This indicates that the shares may be overvalued using this method, particularly given that earnings and revenue are both forecast to decline.
Look into how the SWS DCF model arrives at its fair value.
 9532 Discounted Cash Flow as at Jan 2026
Simply Wall St performs a discounted cash flow (DCF) on every stock in the world every day (check out Osaka Gas for example). We show the entire calculation in full. You can track the result in your watchlist or portfolio and be alerted when this changes, or use our stock screener to discover 876 undervalued stocks based on their cash flows. If you save a screener we even alert you when new companies match – so you never miss a potential opportunity.
Build Your Own Osaka Gas Narrative
If you see the numbers differently or prefer to work from your own assumptions, you can build a personalised Osaka Gas view in just a few minutes, starting with Do it your way.
A great starting point for your Osaka Gas research is our analysis highlighting 3 key rewards and 1 important warning sign that could impact your investment decision.
Ready for more investment ideas?
If Osaka Gas has sharpened your thinking, do not stop here. The Simply Wall St Screener helps you quickly spot other opportunities that fit your style.
This article by Simply Wall St is general in nature. We provide commentary based on historical data
and analyst forecasts only using an unbiased methodology and our articles are not intended to be financial advice. It does not constitute a recommendation to buy or sell any stock, and does not take account of your objectives, or your
financial situation. We aim to bring you long-term focused analysis driven by fundamental data.
Note that our analysis may not factor in the latest price-sensitive company announcements or qualitative material.
Simply Wall St has no position in any stocks mentioned.
New: AI Stock Screener & Alerts
Our new AI Stock Screener scans the market every day to uncover opportunities.
• Dividend Powerhouses (3%+ Yield)
• Undervalued Small Caps with Insider Buying
• High growth Tech and AI Companies
Or build your own from over 50 metrics.
Explore Now for Free
Have feedback on this article? Concerned about the content? Get in touch with us directly. Alternatively, email editorial-team@simplywallst.com
AloJapan.com