
Strong magnitude 5.4 earthquake at 59 km depth
22 May 21:34 UTC: First to report: NIED after 6 minutes.
22 May 21:35: Now using data updates from RENASS
… [show all] …22 May 21:36: Magnitude recalculated from 5.4 to 5.3. Epicenter location corrected by 19 km (12 mi) towards N.
22 May 21:36: Now using data updates from GFZ
22 May 21:37: Now using data updates from EMSC
22 May 21:37: Hypocenter depth recalculated from 56.00 to 51.00 km (from 35 to 32 mi). Epicenter location corrected by 23 km (15 mi) towards SW.
22 May 21:40: Magnitude recalculated from 5.4 to 5.5.
22 May 21:40: Epicenter location corrected by 13 km (8.1 mi) towards SSE.
22 May 21:40: Magnitude recalculated from 5.5 to 5.4.
22 May 21:41: Epicenter location corrected by 1.3 km (0.8 mi) towards W.
22 May 21:43: Hypocenter depth recalculated from 51.00 to 45.70 km (from 32 to 28 mi). Epicenter location corrected by 1.9 km (1.2 mi) towards NNW.
22 May 21:48: Hypocenter depth recalculated from 46.30 to 59.00 km (from 29 to 37 mi). Epicenter location corrected by 5.6 km (3.5 mi) towards SE.
22 May 21:48: Now using data updates from USGS
Update Thu, 22 May 2025, 21:36
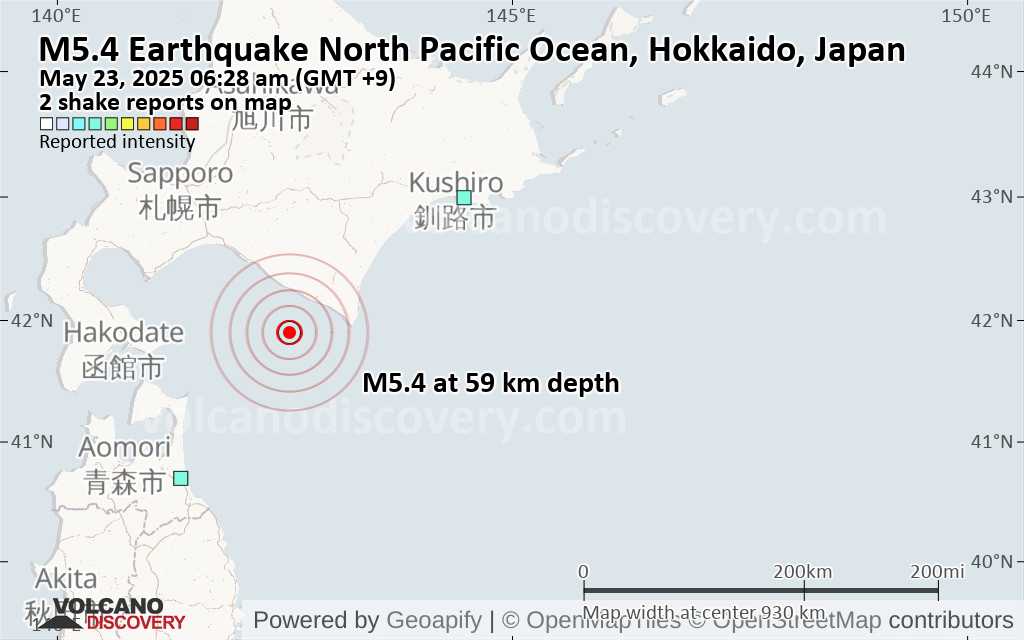
Significant magnitude 5.4 quake hits 33 km south of Shizunai-furukawacho, Japan early morning 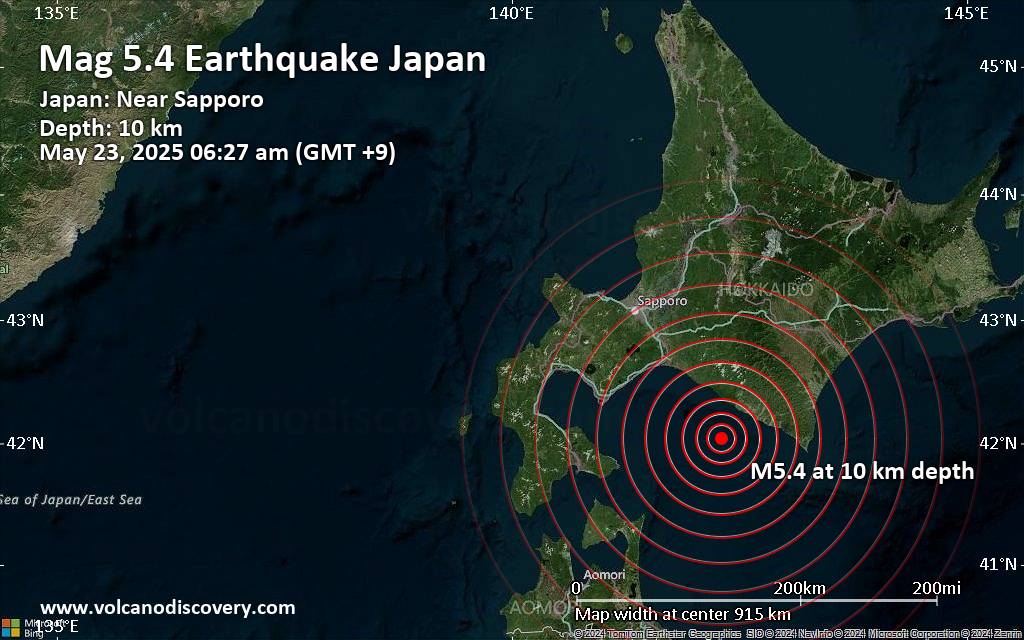 Just 8 minutes ago, a 5.4-magnitude earthquake struck near Shizunai-furukawacho, Hidaka-gun, Hokkaido, Japan. The tremor was recorded early morning on Friday, May 23rd, 2025, at 6:27 am local time, at a shallow depth of 10. km below the surface.
The event was filed by France’s Réseau National de Surveillance Sismique (RéNaSS), the first seismological agency to report it.
A second report was later issued by the citizen-seismograph network of RaspberryShake, which listed it as a magnitude 5.6 earthquake. A third agency, Japan’s National Research Institute for Earth Science and Disaster Resilience (NIED), reported the same quake at magnitude 5.7.
Based on the preliminary seismic data, the quake was probably felt by many people in the area of the epicenter. It should not have caused significant damage, other than objects falling from shelves, broken windows, etc.
In Shizunai-furukawacho (pop. 22,400) located 33 km from the epicenter, Niikappu (pop. 5,700) 35 km away, Urakawa (pop. 12,800) 42 km away, and Monbetsu-honcho (pop. 11,300) 52 km away, the quake should have been felt as light shaking.
Weak shaking might have been felt in Tomakomai (pop. 174,800) located 88 km from the epicenter, Shiraoi (pop. 17,800) 96 km away, Chitose (pop. 98,000) 102 km away, and Muroran (pop. 96,200) 112 km away.
VolcanoDiscovery will automatically update magnitude and depth if these change and follow up if other significant news about the quake become available. If you’re in the area, please send us your experience through our reporting mechanism, either online or via our mobile app. This will help us provide more first-hand updates to anyone around the globe who wants to know more about this quake.Download the Volcanoes & Earthquakes app and get one of the fastest seismic alerts online: Android | iOS
Earthquake details
Date & timeMay 22, 2025 21:28:01 UTC –
Local time at epicenterFriday, May 23, 2025, at 06:28 am (GMT +9)
Statusconfirmed (manually revised)
Magnitude5.4
Depth59 km
Epicenter latitude / longitude41.8988°N / 142.5587°E![]() Hokkaido, Japan
Hokkaido, Japan
Seismic antipode41.8988°S / 37.441°W
Quality106 seismic stations
Shaking intensityIV Light shaking near epicenter
Felt2 reports
Primary data sourceUSGS (United States Geological Survey)
Nearest volcanoE-san (116 km / 72 mi)
Weather at epicenter at time of quakeClear Sky  9.1°C (48 F), humidity: 87%, wind: 9 m/s (17 kts) from NW
Estimated seismic energy released7.9 x 1012 joules (2.21 gigawatt hours, equivalent to 1898 tons of TNT or 0.1 atomic bombs!) | equivalent to ONE quake of magnitude 5.4 | about seismic energy
[show map]
[smaller] [bigger]
Quake possibly felt by 5.7 million people
According to preliminary estimates from the US Geological Survey (USGS), the quake might have been felt by over 5.7 million people across ![]() Japan. For most people (93%), the quake might only have felt as barely noticeable or weak shaking if at all (intensities I-III). Approx. 390,000 people were in areas with light shaking (intensity IV), the highest intensity this quake likely produced over inhabited areas.
Japan. For most people (93%), the quake might only have felt as barely noticeable or weak shaking if at all (intensities I-III). Approx. 390,000 people were in areas with light shaking (intensity IV), the highest intensity this quake likely produced over inhabited areas.
MMI Level
Shaking
 (5,654,700 in total)
Possible damageI Not feltNoneII Very weakNoneIII WeakProbably noneIV LightNone or minor onlyV ModerateMinorVI StrongMinor to ModerateVII Very strongModerateVIII SevereSignificantIX ViolentHeavyX ExtremeCatastrophic
Estimated number of people exposed to shaking from the earthquake by intensity (data coverage corresponding to attached map)
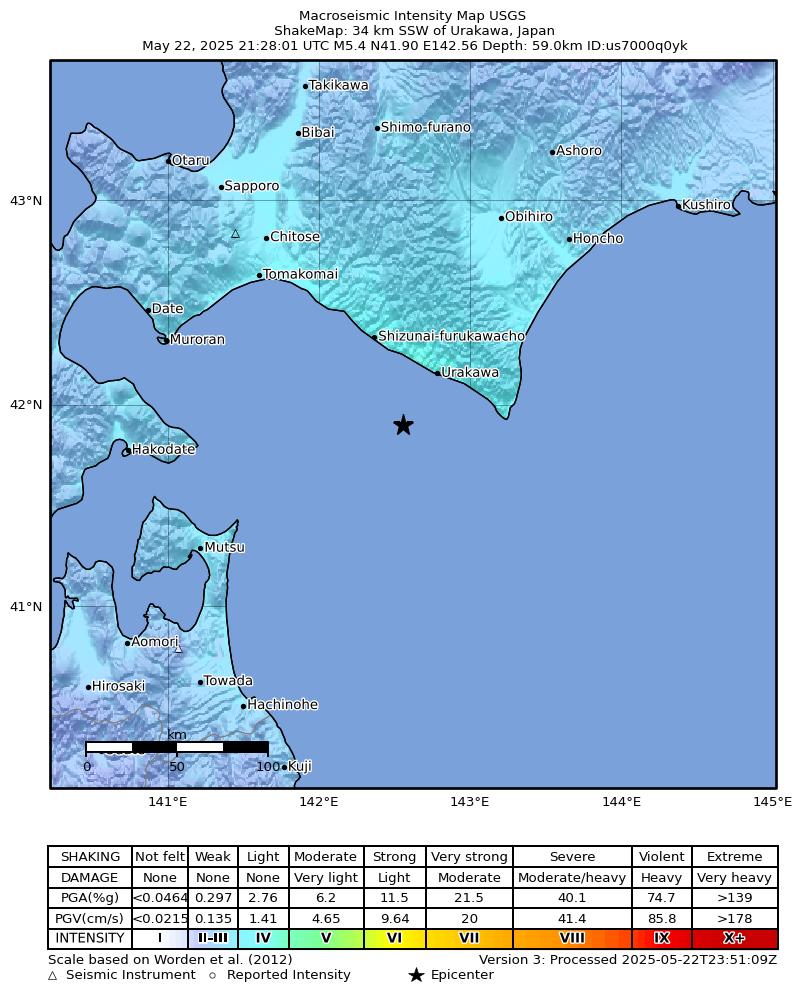
Map of expected ground shaking intensity according to the MMI scale (shakemap, source: USGS)
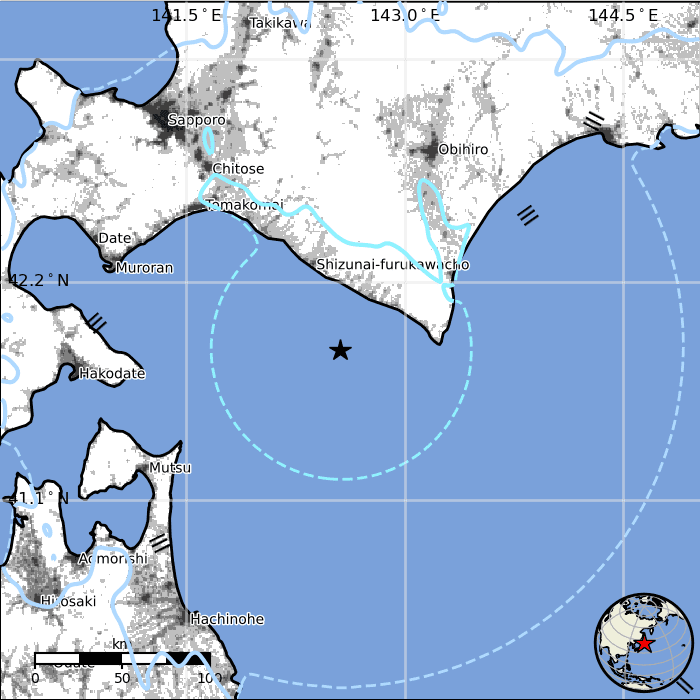
Map with population density (from white to black) in the area around the quake’s epicenter (source: USGS)
Alert level for this earthquake: Level GREEN
Based on seismic and statistical models, USGS estimates that the risk of fatalities and damage from this earthquake is low. The main factors that contribute to this evaluation are:
The maximum expected ground shaking from this quake was unlikely to reach dangerous levels over populated areas; it should not have surpassed intensity IV (Light) on the MMI scale significantly.
A large number of people was exposed to shaking from the quake, but only to weak intensities.
CommentOverall, the population in this region resides in structures that are resistant to earthquake shaking, though vulnerable structures exist. The predominant vulnerable building types are heavy wood frame and reinforced/confined masonry construction.
A magnitude 7.7 earthquake 378 km northwest of this event struck Hokkaido Nansei-Oki, Japan on July 12, 1993 (UTC), with estimated population exposures of 84,000 at intensity VII and 4,000 at intensity VIII, resulting in a reported 230 fatalities.
Recent earthquakes in this area have caused secondary hazards such as landslides and fires that might have contributed to losses.
Source: USGS
Green alert for shaking-related fatalities and economic losses. There is a low likelihood of casualties and damage.
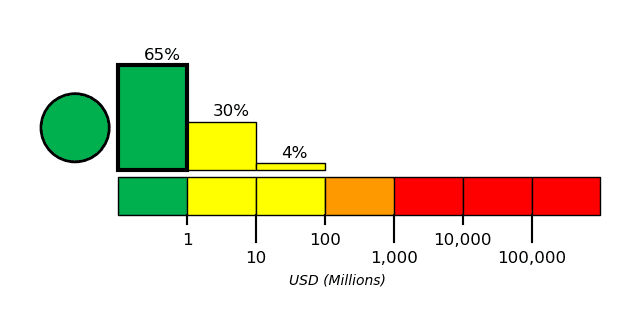
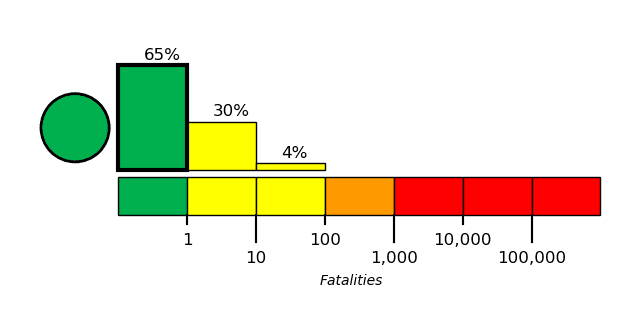
Expected fatalities
The risk of fatalities from this quake is considered low and classified as Level GREEN, the lowest on a color scale from Green (low) to Red (very high).
USGS estimates that there is a 65.3% chance that there are no direct fatalities as effect of shaking and a 30.2% chance that between 1 and 10 fatalities occurred. The likelihood that there are more than 100 fatalities is less than 1%.
Expected economic damage
The economic impact of this earthquake is expected to be minimal or small (Level GREEN). Only light damage if any should have occurred.
USGS calculates an 65.3% chance of total economic loss in the range of 0-1 million US Dollars and a 30.2% risk of losses between 1 and 10 million US Dollars. Total economic loss from this quake is not likely to surpass 10 million US Dollars (less than 1% chance).
Ground shaking from this quake

Map of estimated ground shaking (source:USGS)
Ground accelleration map for this quake
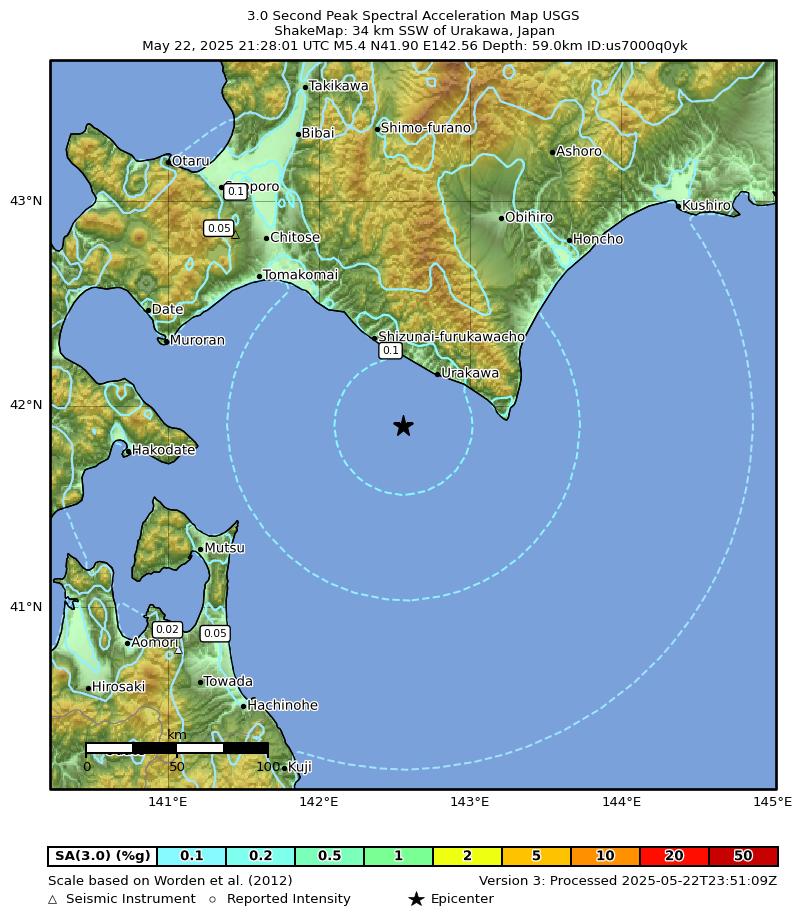
Map of estimated ground accelleration (source:USGS)
Nearby places
The closest larger town where the quake might have been felt is Shizunai-furukawacho, a town with 22,000 inhabitants in Japan, in 51 km (32 mi) distance north of the epicenter. People likely experienced light shaking there. Several smaller towns and villages are located closer to the epicenter and might have experienced stronger shaking. In the capital of ![]() Japan, Tokyo, 734 km (456 mi) away from the epicenter, the earthquake was probably felt as very weak shaking.
Japan, Tokyo, 734 km (456 mi) away from the epicenter, the earthquake was probably felt as very weak shaking.
The following table shows some of the places that might have been affected (or not) by the shaking.
Distance
Place
Max. shaking intensity(*)
Region
Country
34 km (21 mi)
NE of epicenter
Urakawa
(pop: 12,800)
IV: Light
Hokkaido
39 km (24 mi)
NE of epicenter
Honcho
(pop: 4,480)
IV: Light
Samani-gun, Hokkaido
51 km (31 mi)
E of epicenter
Erimo
(pop: 4,370)
IV: Light
Horoizumi-gun, Hokkaido
51 km (32 mi)
N of epicenter
Shizunai-furukawacho
(pop: 22,400)
IV: Light
Hidaka-gun, Hokkaido
74 km (46 mi)
NE of epicenter
Hiroo
(pop: 7,180)
IV: Light
Hokkaido
76 km (47 mi)
NW of epicenter
Monbetsu-honcho
(pop: 11,300)
IV: Light
Saru-gun, Hokkaido
84 km (52 mi)
NW of epicenter
Biratori
(pop: 5,310)
IV: Light
Saru-gun, Hokkaido
89 km (55 mi)
NE of epicenter
Taiki
(pop: 5,420)
IV: Light
Hiroo-gun, Hokkaido
91 km (57 mi)
NW of epicenter
Mukawa
(pop: 7,650)
IV: Light
Yufutsu-gun, Hokkaido
114 km (71 mi)
NW of epicenter
Tomakomai
(pop: 174,800)
III: Weak
Hokkaido
119 km (74 mi)
N of epicenter
Memuro-minami
(pop: 18,000)
III: Weak
Kasai-gun, Hokkaido
123 km (76 mi)
NW of epicenter
Shiraoi
(pop: 17,800)
III: Weak
Hokkaido
125 km (78 mi)
NE of epicenter
Obihiro
(pop: 166,500)
III: Weak
Hokkaido
126 km (78 mi)
NE of epicenter
Sarubetsu
(pop: 25,800)
III: Weak
Nakagawa-gun, Hokkaido
127 km (79 mi)
NW of epicenter
Chitose
(pop: 98,000)
III: Weak
Hokkaido
129 km (80 mi)
NW of epicenter
Noboribetsu
(pop: 46,400)
III: Weak
Hokkaido
131 km (81 mi)
SW of epicenter
Mutsu
(pop: 56,200)
III: Weak
Aomori
132 km (82 mi)
NE of epicenter
Otofuke
(pop: 44,200)
III: Weak
Kato-gun, Hokkaido
137 km (85 mi)
NW of epicenter
Eniwa
(pop: 70,300)
III: Weak
Hokkaido
138 km (86 mi)
W of epicenter
Muroran
(pop: 96,200)
III: Weak
Hokkaido
145 km (90 mi)
NW of epicenter
Kitahiroshima
(pop: 58,900)
III: Weak
Hokkaido
152 km (94 mi)
W of epicenter
Hakodate
(pop: 275,700)
III: Weak
Hokkaido
153 km (95 mi)
NW of epicenter
Date
(pop: 34,900)
III: Weak
Hokkaido
154 km (96 mi)
W of epicenter
Honcho
(pop: 28,500)
III: Weak
Kameda-gun, Hokkaido
158 km (98 mi)
NW of epicenter
Ebetsu
(pop: 134,000)
III: Weak
Hokkaido
159 km (99 mi)
W of epicenter
Kamiiso
(pop: 38,100)
III: Weak
Hokuto Shi, Hokkaido
159 km (99 mi)
NW of epicenter
Iwamizawa
(pop: 85,100)
III: Weak
Hokkaido
160 km (99 mi)
W of epicenter
Hokuto
(pop: 46,100)
III: Weak
Hokkaido
162 km (101 mi)
N of epicenter
Shimo-furano
(pop: 25,900)
III: Weak
Furano Shi, Hokkaido
163 km (102 mi)
NW of epicenter
Sapporo
(pop: 1,973,800)
III: Weak
Hokkaido
169 km (105 mi)
N of epicenter
Bibai
(pop: 29,000)
III: Weak
Hokkaido
179 km (111 mi)
NW of epicenter
Ishikari
(pop: 58,800)
III: Weak
Hokkaido
179 km (111 mi)
SW of epicenter
Hachinohe
(pop: 239,000)
III: Weak
Aomori
191 km (119 mi)
NE of epicenter
Kushiro
(pop: 167,900)
III: Weak
Hokkaido
192 km (119 mi)
N of epicenter
Takikawa
(pop: 45,100)
III: Weak
Hokkaido
192 km (119 mi)
NW of epicenter
Otaru
(pop: 115,300)
III: Weak
Hokkaido
194 km (121 mi)
SW of epicenter
Aomori
(pop: 298,400)
III: Weak
Aomori
209 km (130 mi)
N of epicenter
Asahikawa
(pop: 333,500)
III: Weak
Hokkaido
238 km (148 mi)
NE of epicenter
Kitami
(pop: 119,100)
III: Weak
Hokkaido
734 km (456 mi)
S of epicenter
Tokyo
(pop: 8,336,600)
II: Very weak
Tokyo
Notes:
(*) Shaking intensity according to the Modified Mercalli Intensity Scale (MMI) and estimated using seismic models.
User-reports for this quake (3)

We received 3 reports for this quake from ![]() Japan. Out of these, 2 people indicated they felt it. The quake was reported to have been felt in up to approx. 180–200 km (112–124 mi) distance.
Japan. Out of these, 2 people indicated they felt it. The quake was reported to have been felt in up to approx. 180–200 km (112–124 mi) distance.
Most reports came from Kushiro (1 report), a city with more than 170,000 inhabitants in Hokkaido in 191 km (119 mi) distance northeast of the epicenter, ![]() Japan, and Misawa (1 report) (166 km or 103 mi to the southwest), a town with 43,000 inhabitants in Aomori. Further below is a list of places where most people reported this quake.
Japan, and Misawa (1 report) (166 km or 103 mi to the southwest), a town with 43,000 inhabitants in Aomori. Further below is a list of places where most people reported this quake.
Contribute:
Leave a comment if you find a particular report interesting or want to add to it.
Flag as inappropriate.
Mark as helpful or interesting.
Send your own user report!
Den’enchofu, Ōta, Tokyo (742.9 km SSW of epicenter) [Map] / not felt (reported through our app)
Misawa, Japan (167.2 km SW of epicenter) [Map] / Light shaking (MMI IV) / horizontal (sideways) swinging / 30-60 s
Kushiro, Japan (198.5 km NE of epicenter) [Map] / Light shaking (MMI IV) / both vertical and horizontal swinging / 5-10 s
List of cities/places with most reports
PlaceDistance from epicenterAverage reported Shaking IntensityNr. of reportsKushiro, Hokkaido, ![]() Japan
Japan
(Pop.: 167,875)
191 km (119 mi)
NE of epicenter
IV: Light shaking1Misawa, Aomori, ![]() Japan
Japan
(Pop.: 42,805)
166 km (103 mi)
SW of epicenter
IV: Light shaking1
Note: Only reports with latitude/longitude coordinate positions given (3 in total) could be used for statistics.
What is Intensity and the Mercalli Intensity Scale?
The amount of shaking that occurs on the surface due to an earthquake is called the intensity. It is commonly measured on the so-called Modified Mercalli Intensity Scale (MMI) ranging from 1 (not felt) to 10 (extreme shaking), and given in Roman numerals as I,II,…IX, X, and often displayed with color codes ranging from light blue to dark red.
Earthquake intensity depends mainly on the magnitude and depth of the quake as well as the distance from the epicenter: The further away, the less shaking intensity occurs.
Read more about the MMI scale!Number of reports by intensity
Shaking intensityNumber of reportsMin-Max distance from epicenter (*)Average distance (*)I: Not felt1742–742 km (461–461 mi)742 km (461 mi)IV: Light shaking2167–198 km (104–123 mi)183 km (113 mi)
Notes
(*) Reports are filtered to exclude those that are likely highly inaccurate or esaggerated.
Only reports with latitude/longitude coordinate positions given (3 in total) could be used for geographic statistics.
Compare Quake DataData for the same earthquake as reported by different agencies
The more agencies report about the same quake and post similar data, the more confidence you can have in the data. It takes normally up to a few hours until earthquake parameters are calculated with near-optimum precision.
Mag
Depth
Time GMT
2025-05-22
Epicenter
Agency
5.4
59 km
37 mi
±5.8 km
21:28:01.572
34 km SSW of Urakawa, Japan
Epicenter uncertainty: ± 3.2 km
USGS (United States Geological Survey)
5.7
63 km
39 mi
21:28:00
S OFF URAKAWA
15 km (9.3 mi) epicenter difference with USGS
NIED (National Research Institute for Earth Science and Disaster Resilience)
5.5
69 km
43 mi
21:28:00
Hokkaido, Japan Region
42 km (26 mi) epicenter difference with USGS
RaspberryShake (RaspberryShake)
5.38
± 0.18
10 km
6.2 mi
(*)
21:27:56.77
±0.22s
Event of magnitude 5.4, near of Sapporo
26 km (16 mi) epicenter difference with USGS
Epicenter uncertainty: ± 4 km
RENASS (Réseau National de Surveillance Sismique (RéNaSS))
5.39
61 km
38 mi
±0.7 km
21:28:01.97
Hokkaido, Japan Region
8.3 km (5.2 mi) epicenter difference with USGS
Epicenter uncertainty: ± 4.1 km
GFZ (German Research Centre for Geosciences)
5.4
60 km
37 mi
21:28:01.69
±0.23s
HOKKAIDO, JAPAN REGION
5 km (3.1 mi) epicenter difference with USGS
Epicenter uncertainty: ± 4.5 km
EMSC (European-Mediterranean Seismological Centre)
5.4
59 km
37 mi
21:28:01
HOKKAIDO, JAPAN REGION
0 km (0 mi) epicenter difference with USGS
IRIS (Incorporated Research Institutions for Seismology)
5.6
54 km
33 mi
21:28:00
S OFF URAKAWA
10 km (6.2 mi) epicenter difference with USGS
JMA (Japan Meteorological Agency)
5.38
57 km
35 mi
±2.3 km
21:28:02.108
±0.24s
Hokkaido, Japan Region
2.8 km (1.8 mi) epicenter difference with USGS
Epicenter uncertainty: ± 4.5 km
GeoAu (Geoscience Australia )
Notes:
(*) A depth given as 10 km often means that the the depth of the quake could be not determined with sufficient accuracy.
2 aftershocks for this quakeFor this earthquake, 2 aftershocks (above mag. 2) have been detected so far. The strongest was a magnitude 2.7 quake that hit 14 days after the mainshock in 2.6 km (1.6 mi) distance, in 37 km southwest of Urakawa, Hokkaido, Japan, on Friday, Jun 6, 2025 on 01:21 am (Tokyo local time GMT +9).
What are aftershocks?
Larger earthquakes (above magnitude 5 or so) such as this one are usually followed by smaller ones known as aftershocks that occur in the same area during the days, weeks, months or even years after the main shock.
[More info]
Aftershocks are typically at least one order of magnitude smaller than the main shock. Their size and frequency decreases with time.
What about this quake?
Based on its magnitude, the fault that was active during the quake likely ruptured beneath a surface area of approximately 25 km2 (10 square miles) as a first-order estimate. The length of the rupture zone thus was probably around 9 km (5 mi).
[More info]
Aftershocks for this quake can be expected to occur during the days and few weeks following the quake at or near the same fault, at distances of up to approx. two times the length of the rupture zone, or in this case 17 km (11 mi). The often broadly linear arrangement of aftershock epicenters encompasses the rupture zone of the main shock (see map below).Recorded aftershocks, latest first (2 quakes)Jun 6, 2025 01:21 am (GMT +9)
20 weeks ago
14 days after main shock
2.7
64 km2.6 km (1.6 mi)
SW of main shock
Japan: S Off UrakawaMoreJun 6, 2025 01:21 am (GMT +9)
20 weeks ago
14 days after main shock
2.7
64 km2.6 km (1.6 mi)
SW of main shock
Japan: S Off UrakawaMoreMay 23, 2025 06:28 am (GMT +9)
21 weeks ago – felt
5.4
59 km0 km – This quakeNorth Pacific Ocean, 51 km S of Shizunai-furukawacho, Hokkaido, Japan
Main Shock (this quake)
More
Map of aftershocks
Earthquake statisticsAverage number of earthquakes
Based on data from the past 25 years and our earthquake archive back to 1900, there are about 907 quakes on average per year in the area near the epicenter of this quake (within 100 km/61 mi):
Mag. 7 or higher: 0.03 quakes per year (or 1 quake every 31.3 years)Mag. 6 or higher: 0.5 quakes per year (or 1 quake every 2 years)Mag. 5 or higher: 5.6 quakes per yearMag. 4 or higher: 47 quakes per year (or 3.9 quakes per month)Mag. 3 or higher: 122 quakes per year (or 10.2 quakes per month)Mag. 2 or higher: 281 quakes per year (or 23.5 quakes per month)Mag. 1 or higher: 688 quakes per year (or 57 quakes per month)
The area where this quake occurred has a very high level of seismic activity. It has had at least 4 quakes above magnitude 7 since 1900, which suggests that larger earthquakes of this size occur infrequently, probably on average approximately every 30 to 35 years.
Number of quakes per year
Previous quakes in the same area of this earthquake
Max results10
2050100
All
Magnitude
All2+
3+4+5+
6+7+8+
Time before
48 hours
1 week
30 days
1 year
5 years
30 years
Any age
Date and Time Mag
Mag
DepthDistanceLocationDetailsMap
Map of earlier quakes in the area of this quake
Max results10
2050100
All
Magnitude
All2+
3+4+5+
6+7+8+
Time before
48 hours
1 week
30 days
1 year
5 years
30 years
Any age
Oldest quakes are shown in yellow, most recent in red.
[quakes -] [quakes +] [smaller] [bigger]
AloJapan.com