
 A Risky Investment?")
The external fund manager backed by Berkshire Hathaway’s Charlie Munger, Li Lu, makes no bones about it when he says ‘The biggest investment risk is not the volatility of prices, but whether you will suffer a permanent loss of capital.’ When we think about how risky a company is, we always like to look at its use of debt, since debt overload can lead to ruin. Importantly, Osaka Steel Co., Ltd. (TSE:5449) does carry debt. But the real question is whether this debt is making the company risky.
AI is about to change healthcare. These 20 stocks are working on everything from early diagnostics to drug discovery. The best part – they are all under $10bn in marketcap – there is still time to get in early.
What Risk Does Debt Bring?
Debt is a tool to help businesses grow, but if a business is incapable of paying off its lenders, then it exists at their mercy. In the worst case scenario, a company can go bankrupt if it cannot pay its creditors. However, a more frequent (but still costly) occurrence is where a company must issue shares at bargain-basement prices, permanently diluting shareholders, just to shore up its balance sheet. Of course, plenty of companies use debt to fund growth, without any negative consequences. When we examine debt levels, we first consider both cash and debt levels, together.
How Much Debt Does Osaka Steel Carry?
The chart below, which you can click on for greater detail, shows that Osaka Steel had JP¥14.6b in debt in June 2025; about the same as the year before. But it also has JP¥15.6b in cash to offset that, meaning it has JP¥1.01b net cash.
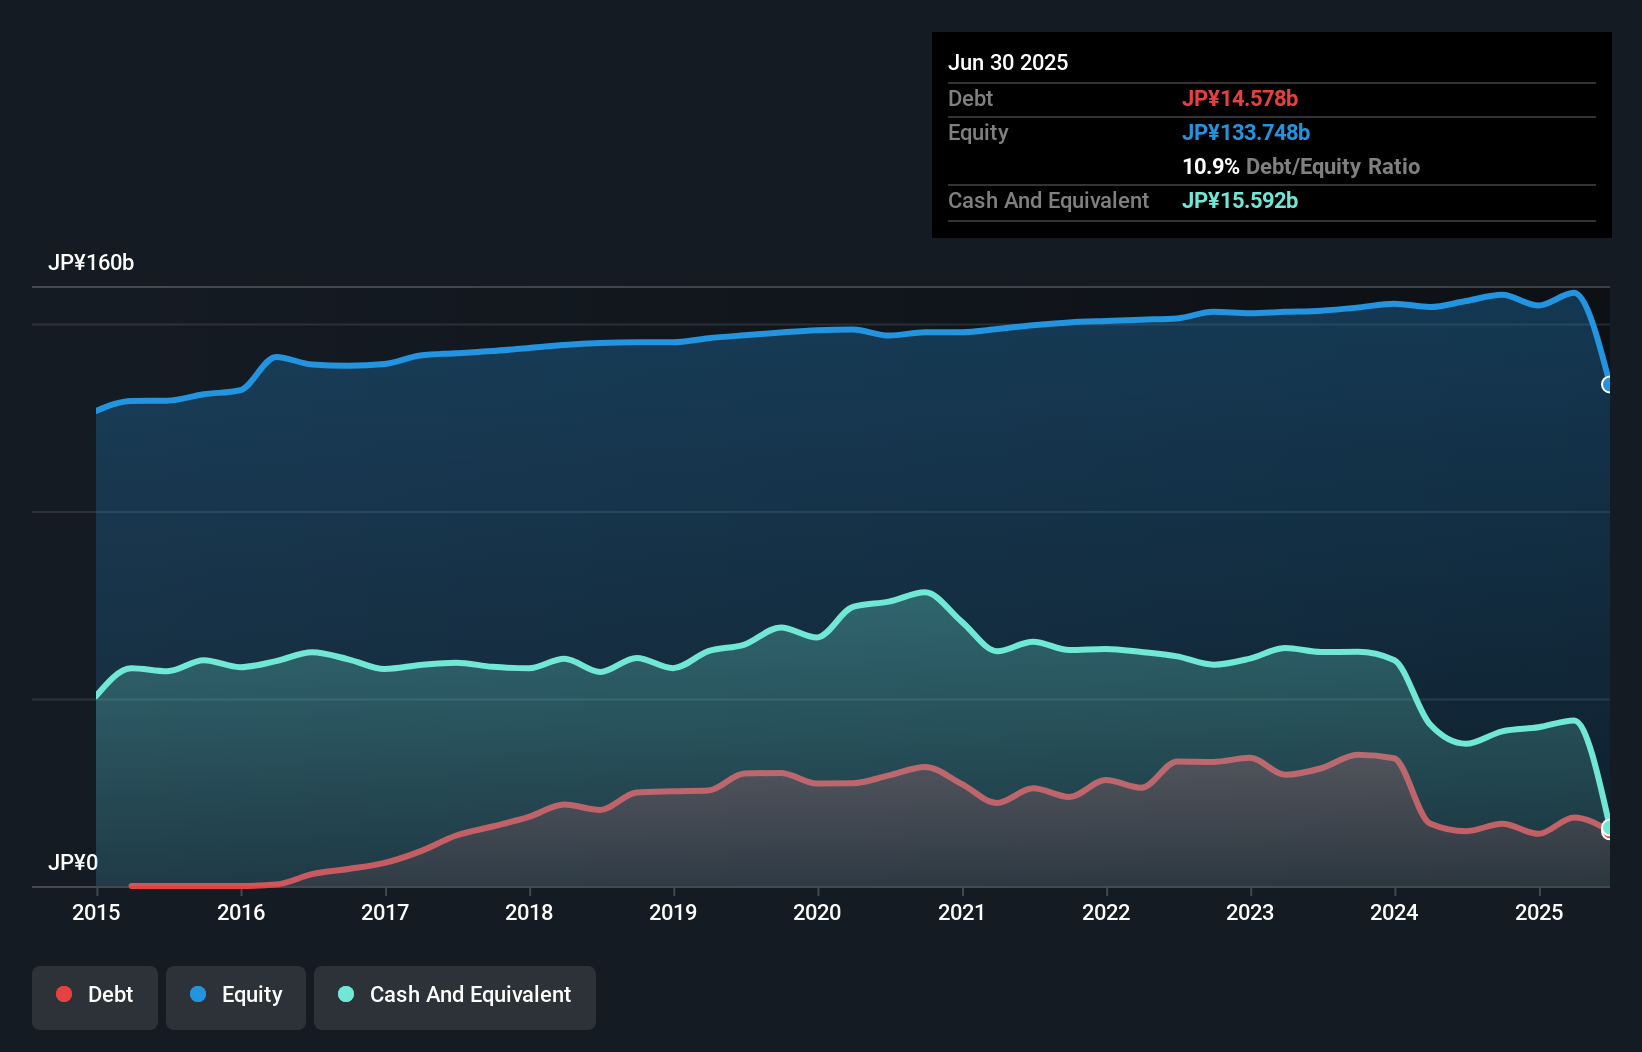 TSE:5449 Debt to Equity History September 30th 2025 A Look At Osaka Steel’s Liabilities
We can see from the most recent balance sheet that Osaka Steel had liabilities of JP¥32.8b falling due within a year, and liabilities of JP¥4.77b due beyond that. Offsetting these obligations, it had cash of JP¥15.6b as well as receivables valued at JP¥31.8b due within 12 months. So it can boast JP¥9.81b more liquid assets than total liabilities.
This short term liquidity is a sign that Osaka Steel could probably pay off its debt with ease, as its balance sheet is far from stretched. Succinctly put, Osaka Steel boasts net cash, so it’s fair to say it does not have a heavy debt load!
Check out our latest analysis for Osaka Steel
The modesty of its debt load may become crucial for Osaka Steel if management cannot prevent a repeat of the 58% cut to EBIT over the last year. When it comes to paying off debt, falling earnings are no more useful than sugary sodas are for your health. There’s no doubt that we learn most about debt from the balance sheet. But it is Osaka Steel’s earnings that will influence how the balance sheet holds up in the future. So if you’re keen to discover more about its earnings, it might be worth checking out this graph of its long term earnings trend.
Finally, while the tax-man may adore accounting profits, lenders only accept cold hard cash. Osaka Steel may have net cash on the balance sheet, but it is still interesting to look at how well the business converts its earnings before interest and tax (EBIT) to free cash flow, because that will influence both its need for, and its capacity to manage debt. Considering the last three years, Osaka Steel actually recorded a cash outflow, overall. Debt is far more risky for companies with unreliable free cash flow, so shareholders should be hoping that the past expenditure will produce free cash flow in the future.
Summing Up
While we empathize with investors who find debt concerning, you should keep in mind that Osaka Steel has net cash of JP¥1.01b, as well as more liquid assets than liabilities. So we are not troubled with Osaka Steel’s debt use. The balance sheet is clearly the area to focus on when you are analysing debt. But ultimately, every company can contain risks that exist outside of the balance sheet. For example – Osaka Steel has 1 warning sign we think you should be aware of.
At the end of the day, it’s often better to focus on companies that are free from net debt. You can access our special list of such companies (all with a track record of profit growth). It’s free.
New: AI Stock Screener & Alerts
Our new AI Stock Screener scans the market every day to uncover opportunities.
• Dividend Powerhouses (3%+ Yield)
• Undervalued Small Caps with Insider Buying
• High growth Tech and AI Companies
Or build your own from over 50 metrics.
Explore Now for Free
Have feedback on this article? Concerned about the content? Get in touch with us directly. Alternatively, email editorial-team (at) simplywallst.com.
This article by Simply Wall St is general in nature. We provide commentary based on historical data and analyst forecasts only using an unbiased methodology and our articles are not intended to be financial advice. It does not constitute a recommendation to buy or sell any stock, and does not take account of your objectives, or your financial situation. We aim to bring you long-term focused analysis driven by fundamental data. Note that our analysis may not factor in the latest price-sensitive company announcements or qualitative material. Simply Wall St has no position in any stocks mentioned.
AloJapan.com