

If you have been watching Micron Technology, you have probably noticed some eye-popping numbers lately. Over the past year, the stock has climbed nearly 80%, and year-to-date, it is up a remarkable 81.9%. More strikingly, in the last 30 days alone, Micron has surged 31.4%, with a 17.4% jump in just the last week. That kind of momentum is hard to ignore, and it has many investors asking whether there is still room to run or if all the good news is already baked in.
Much of this optimism has been fueled by recent headlines. Japan’s pledge of $3.6 billion to help Micron ramp up advanced DRAM production by 2028 sent a signal about long-term demand and global support for the company. At the same time, international policy moves, like China’s investigation into U.S. chip trade and potential tariffs on semiconductor imports, have created some volatility but also highlighted how strategically important Micron has become in the tech supply chain. Investors appear to be balancing these opportunities with shifting risks, which helps explain the big swings in Micron’s price recently.
With all that action, you might wonder if Micron is getting ahead of itself or if the valuation still makes sense. According to our proprietary scoring, Micron is undervalued in 3 out of 6 valuation checks, giving the company a value score of 3. That is a decent showing, but it only tells part of the story. In the next section, we will break down those valuation approaches and hint at a smarter, more nuanced way to judge where Micron really stands.
Micron Technology delivered 79.8% returns over the last year. See how this stacks up to the rest of the Semiconductor industry. Approach 1: Micron Technology Discounted Cash Flow (DCF) Analysis
A Discounted Cash Flow (DCF) model estimates a company’s intrinsic value by projecting its future free cash flows and discounting them back to their present value. The aim is to account for both anticipated growth and the risk of those cash flows actually materializing.
Looking at Micron Technology, the company’s latest twelve months of Free Cash Flow (FCF) is $1.44 Billion. Analyst estimates project FCF to rise steeply over the coming years, with a forecast of $8.09 Billion in 2029. These forecasts use both analyst consensus for the next five years and then extrapolate further, suggesting substantial growth in Micron’s cash-generating potential over the next decade.
Despite these optimistic projections, the DCF-derived intrinsic value for Micron comes out to $67.01 per share. Compared to the current market price, this implies the stock is trading at a 137.0% premium to its estimated fair value, meaning it is significantly overvalued based on this method.
Result: OVERVALUED
Head to the Valuation section of our Company Report for more details on how we arrive at this Fair Value for Micron Technology. 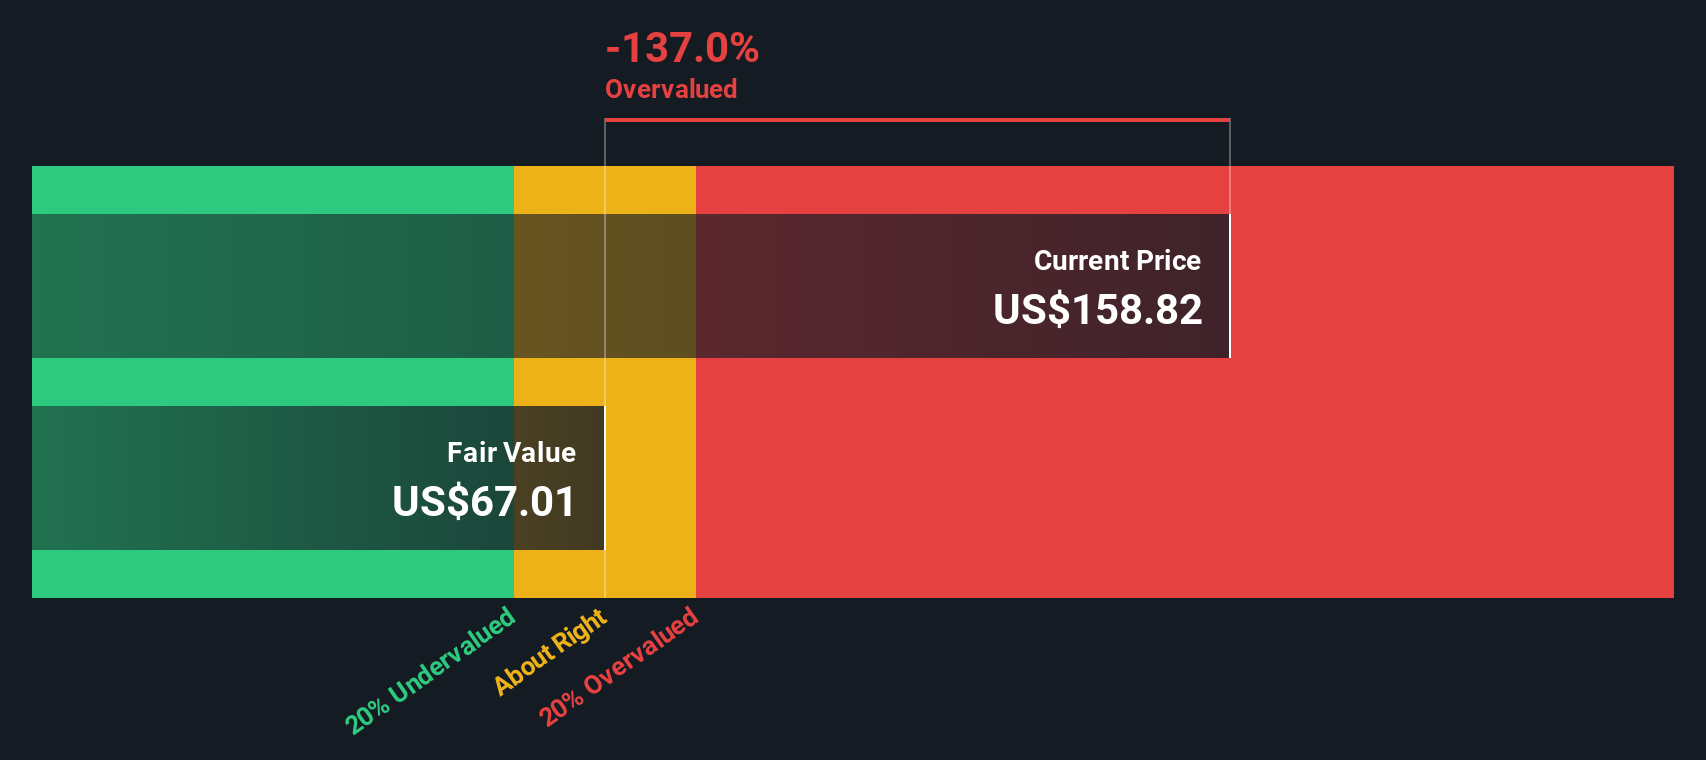 MU Discounted Cash Flow as at Sep 2025 Our Discounted Cash Flow (DCF) analysis suggests Micron Technology may be overvalued by 137.0%. Find undervalued stocks or create your own screener to find better value opportunities.
Approach 2: Micron Technology Price vs Earnings (P/E)
For profitable companies like Micron Technology, the Price-to-Earnings (P/E) ratio is one of the most insightful valuation tools. This metric reflects how much investors are willing to pay for each dollar of earnings, making it particularly useful for comparing companies with steady profits. The “right” P/E ratio depends on expectations for future growth and risk. Higher growth potential or a safer business typically justifies a higher P/E, while lower profitability or uncertain outlook warrants a lower one.
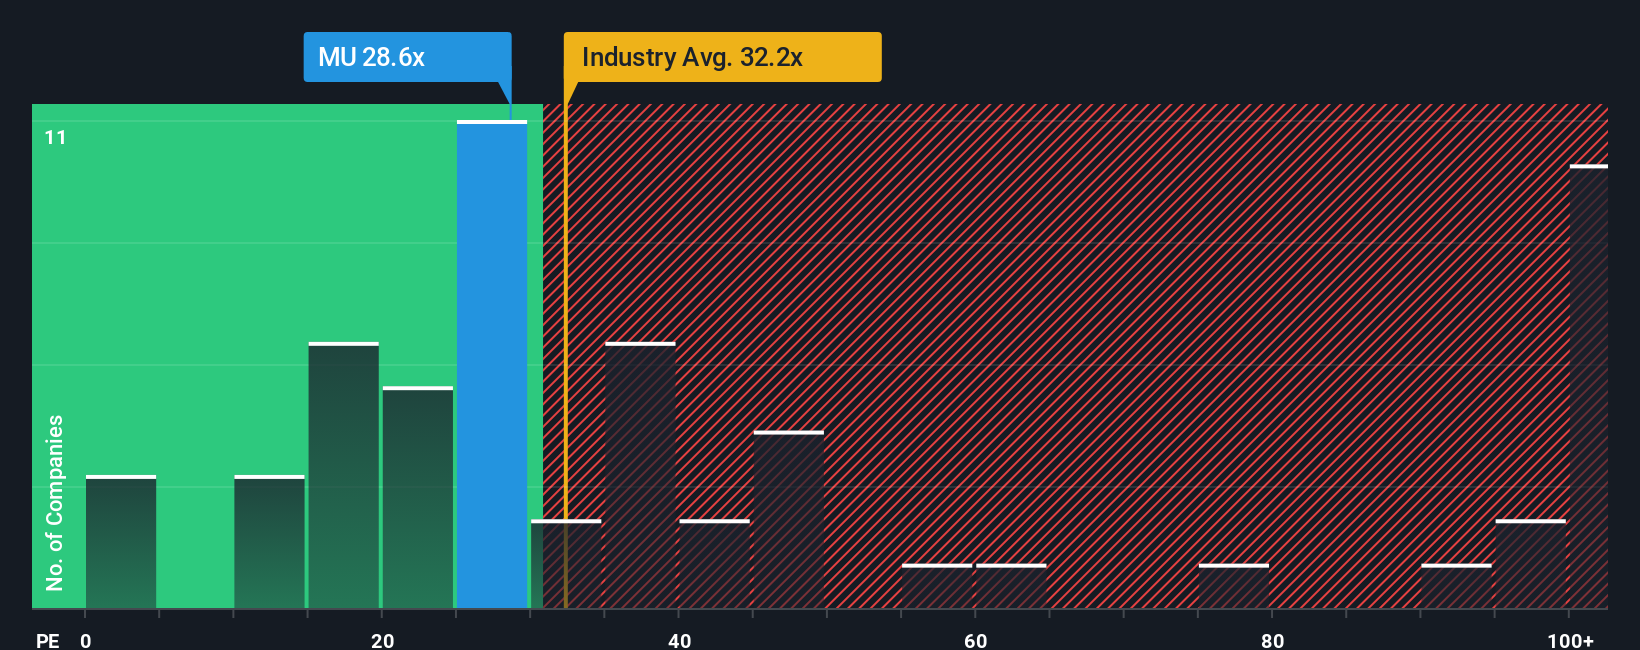
Micron’s current P/E ratio stands at 28.6x. This puts it below the average of its semiconductor industry peers, which sits at 51.0x, and is also lower than the broader industry average of 32.2x. On the surface, this suggests Micron might be priced more conservatively than its competitors. However, a simple comparison to industry benchmarks can overlook important factors specific to Micron’s business outlook.
That is where the Simply Wall St “Fair Ratio” comes in. Unlike basic peer or industry comparisons, the Fair Ratio incorporates additional factors such as Micron’s earnings growth prospects, risk profile, profit margins, position within the industry and even its market cap. For Micron, the Fair Ratio is 43.2x, which is a more tailored benchmark for what investors should expect given its specific fundamentals. Since Micron’s actual P/E (28.6x) is well below this Fair Ratio, the stock currently looks attractively valued on an earnings basis.
Result: UNDERVALUED
 NasdaqGS:MU PE Ratio as at Sep 2025 PE ratios tell one story, but what if the real opportunity lies elsewhere? Discover companies where insiders are betting big on explosive growth. Upgrade Your Decision Making: Choose your Micron Technology Narrative
Earlier we mentioned a smarter, more nuanced way to assess Micron’s value, so let’s introduce you to Narratives. A Narrative is a story or personal view that ties together your expectations for Micron’s future (like assumed fair value, revenue, and earnings growth), the reasons behind those expectations, and how they translate into a price estimate. Narratives bridge the gap between the headlines and the hard numbers, helping you connect changes in the business environment or news to Micron’s financial forecasts and current value.
Narratives are easy to build and update directly on Simply Wall St’s Community page, where millions of investors use them to encapsulate their outlooks. This tool empowers you to make more confident buy or sell decisions by clearly comparing your calculated Fair Value, based on your assumptions, to the current market price. Narratives also update dynamically as new earnings releases, news headlines, or industry events occur, letting you steadily refine your viewpoint.
For instance, some investors think demand driven by AI and data centers means Micron is worth as much as $200 per share, while others, factoring in risks like volatile memory markets and global competition, see fair value closer to $95 per share. Your Narrative will depend on where you see the future, and that’s the real power of this approach.
Do you think there’s more to the story for Micron Technology? Create your own Narrative to let the Community know! 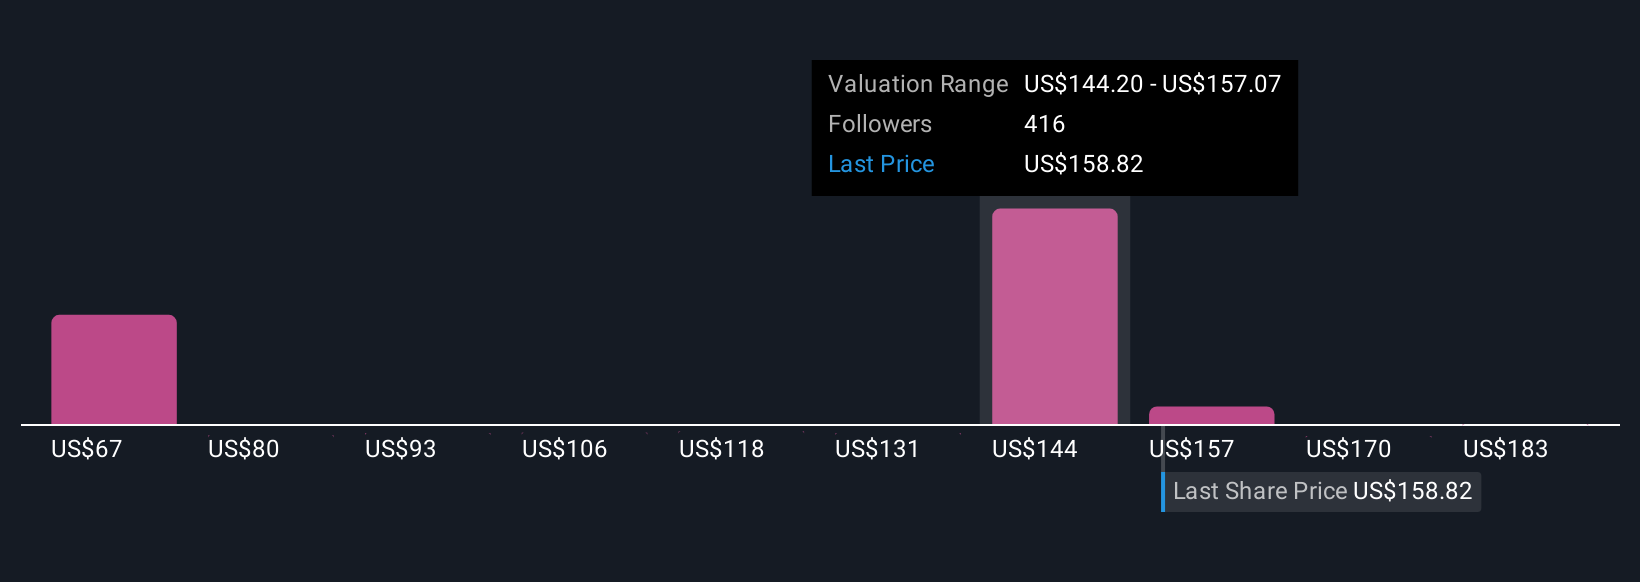 NasdaqGS:MU Community Fair Values as at Sep 2025
This article by Simply Wall St is general in nature. We provide commentary based on historical data
and analyst forecasts only using an unbiased methodology and our articles are not intended to be financial advice. It does not constitute a recommendation to buy or sell any stock, and does not take account of your objectives, or your
financial situation. We aim to bring you long-term focused analysis driven by fundamental data.
Note that our analysis may not factor in the latest price-sensitive company announcements or qualitative material.
Simply Wall St has no position in any stocks mentioned.
New: Manage All Your Stock Portfolios in One Place
We’ve created the ultimate portfolio companion for stock investors, and it’s free.
• Connect an unlimited number of Portfolios and see your total in one currency
• Be alerted to new Warning Signs or Risks via email or mobile
• Track the Fair Value of your stocks
Try a Demo Portfolio for Free
Have feedback on this article? Concerned about the content? Get in touch with us directly. Alternatively, email editorial-team@simplywallst.com
AloJapan.com