
 investors has risen faster than earnings growth over the last five years")
The TOKYO KEIKI INC. (TSE:7721) share price has had a bad week, falling 11%. But that doesn’t change the fact that the returns over the last half decade have been spectacular. In fact, during that period, the share price climbed 367%. Impressive! Arguably, the recent fall is to be expected after such a strong rise. The most important thing for savvy investors to consider is whether the underlying business can justify the share price gain.
Although TOKYO KEIKI has shed JP¥9.0b from its market cap this week, let’s take a look at its longer term fundamental trends and see if they’ve driven returns.
This technology could replace computers: discover the 20 stocks are working to make quantum computing a reality.
There is no denying that markets are sometimes efficient, but prices do not always reflect underlying business performance. One imperfect but simple way to consider how the market perception of a company has shifted is to compare the change in the earnings per share (EPS) with the share price movement.
During five years of share price growth, TOKYO KEIKI achieved compound earnings per share (EPS) growth of 23% per year. This EPS growth is lower than the 36% average annual increase in the share price. So it’s fair to assume the market has a higher opinion of the business than it did five years ago. And that’s hardly shocking given the track record of growth.
The company’s earnings per share (over time) is depicted in the image below (click to see the exact numbers).
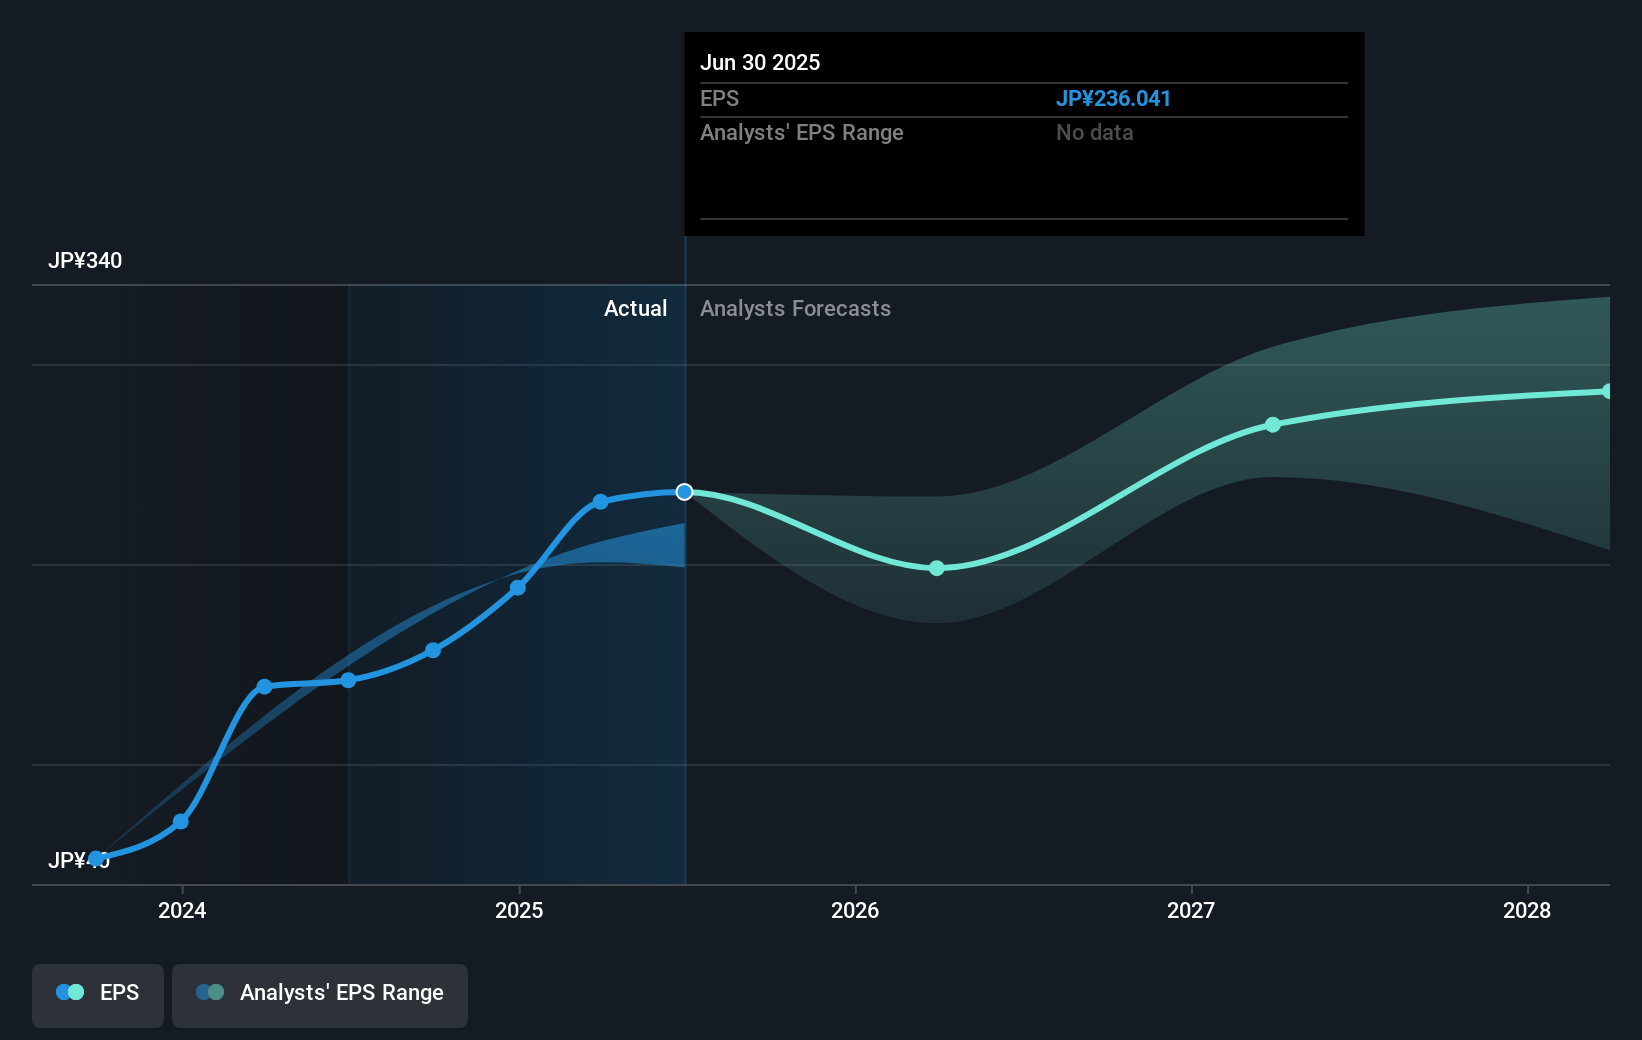 TSE:7721 Earnings Per Share Growth September 1st 2025
It is of course excellent to see how TOKYO KEIKI has grown profits over the years, but the future is more important for shareholders. This free interactive report on TOKYO KEIKI’s balance sheet strength is a great place to start, if you want to investigate the stock further.
What About Dividends?
It is important to consider the total shareholder return, as well as the share price return, for any given stock. Whereas the share price return only reflects the change in the share price, the TSR includes the value of dividends (assuming they were reinvested) and the benefit of any discounted capital raising or spin-off. It’s fair to say that the TSR gives a more complete picture for stocks that pay a dividend. We note that for TOKYO KEIKI the TSR over the last 5 years was 415%, which is better than the share price return mentioned above. And there’s no prize for guessing that the dividend payments largely explain the divergence!
A Different Perspective
It’s nice to see that TOKYO KEIKI shareholders have received a total shareholder return of 40% over the last year. And that does include the dividend. That gain is better than the annual TSR over five years, which is 39%. Therefore it seems like sentiment around the company has been positive lately. Given the share price momentum remains strong, it might be worth taking a closer look at the stock, lest you miss an opportunity. It’s always interesting to track share price performance over the longer term. But to understand TOKYO KEIKI better, we need to consider many other factors. Consider for instance, the ever-present spectre of investment risk. We’ve identified 1 warning sign with TOKYO KEIKI , and understanding them should be part of your investment process.
For those who like to find winning investments this free list of undervalued companies with recent insider purchasing, could be just the ticket.
Please note, the market returns quoted in this article reflect the market weighted average returns of stocks that currently trade on Japanese exchanges.
Valuation is complex, but we’re here to simplify it.
Discover if TOKYO KEIKI might be undervalued or overvalued with our detailed analysis, featuring fair value estimates, potential risks, dividends, insider trades, and its financial condition.
Access Free Analysis
Have feedback on this article? Concerned about the content? Get in touch with us directly. Alternatively, email editorial-team (at) simplywallst.com.
This article by Simply Wall St is general in nature. We provide commentary based on historical data and analyst forecasts only using an unbiased methodology and our articles are not intended to be financial advice. It does not constitute a recommendation to buy or sell any stock, and does not take account of your objectives, or your financial situation. We aim to bring you long-term focused analysis driven by fundamental data. Note that our analysis may not factor in the latest price-sensitive company announcements or qualitative material. Simply Wall St has no position in any stocks mentioned.
AloJapan.com