

DatasetsPopulation influx data
The location information used in this study to estimate the population influx in 500 m2 meshes is extracted from the system logs of the mobile cell towers of SoftBank, which is one of the lines of Zenkoku-Ugoki-Tokei36. A 500 m2 mesh refers to an area from which a region is divided into 500 m long square mesh grid cells. It is based on the creation method established by the Japanese Ministry of Internal Affairs and Communications37.
Origin–destination data (OD data) are obtained via the process shown in Fig. 3. Because these data are anonymized and statistical, individual customers could not be identified. Because seeing whether a user has communicated from locations registered in the data records is prohibited, the data processed for this system log do not violate communication privacy. The SoftBank Corporation website38 provides more information about the policies for the use and application of customer data.
Fig. 3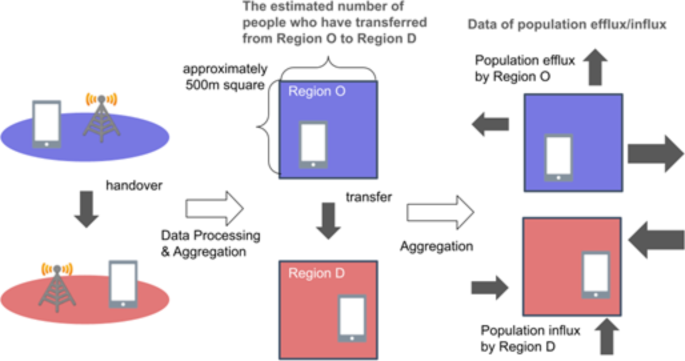
Data processing scheme used to obtain the population influx data. Each mobile phone in service registers its current location (left) regardless of whether the user communicates (e.g., makes or receives phone calls). Because the system logs the users of SoftBank whose consent is acquired, origin–destination data (OD data) are obtained. These data reflect the estimated number of people who moved from a specific region (O) to another specific region (D) (middle). The values in the OD dataset are the expected numbers of people, including non-SoftBank users, in a given area. By simply calculating the sum of the OD values without grouping them based on the O region, we obtain the population influx data (right).
The destination regions (D) and the period of the population influx data used in this study are based on 500 m2 meshes in the entire area of the 23 wards of Tokyo; the duration considered in this study is from November 1st, 2020, to September 3rd, 2022. The population influxes in this study are the estimated values of the resident flows in the 23 wards of Tokyo.
The population influx data include resident city information. Thus, we use the data only for people living in the 23 wards of Tokyo for comparison with new COVID-19 cases reported in the same regions. The distributions of the downtown areas, business districts and residential areas in the 23 wards of Tokyo are shown in Fig. 4.
Fig. 4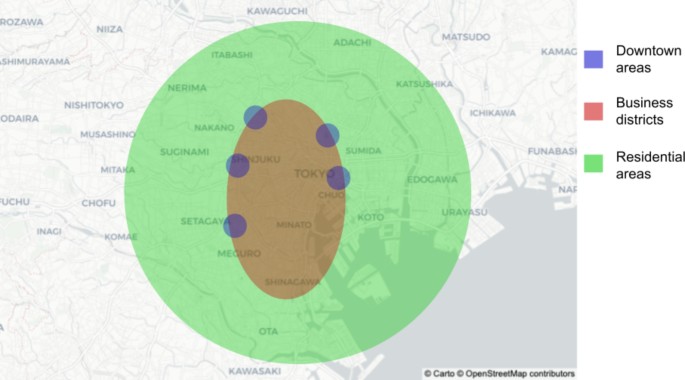
Streetscapes of the 23 wards of Tokyo. It is assumed that each region in the 23 wards of Tokyo can be divided into regional characteristics based on its positional relationship with the train network since Tokyo has well-developed train transportation systems. The Japan Railways (JRs) Yamanote line, which is a circular train network, serves the 23 wards of Tokyo. In general, the business area is distributed inside the JR Yamanote line, and the residential area is distributed outside the JR Yamanote line. In addition, the downtown areas are scattered around the main stations on the JR Yamanote line, such as Shibuya, Shinjuku, Ikebukuro, Ueno, and Ginza. The base map is from OpenStreetMap (https://www.openstreetmap.org/), which is available under the Open Data Commons Open Database Licence. The map style is from CARTO (https://carto.com/), which is available under the Creative Commons Attribution 4.0 Licence.
Data for new COVID-19 cases
The data regarding the number of new COVID-19 cases are obtained from the portal site of the Bureau of Social Welfare and Public Health39. In this study, we use the number of new COVID-19 cases identified in the 23 wards of Tokyo; the duration considered in this study is from October 19, 2020, to September 3, 2022. Some observations are excluded from this study because they are outliers due to counting errors.
Analysis methodCalculation of the effective reproduction number
We convert the data for the new COVID-19 cases into daily series of effective reproduction numbers via the simplified formula suggested by Nishiura et al.31:
$$\widehat{R}[d]={\left(\frac{{\sum }_{j=1}^{T}C\left[d-T+j\right]}{{\sum }_{j=1}^{T}C[d-2T+j]}\right)}^{\left(g/T\right)} ,$$
(1)
where \(\widehat{R}\)[d] and C[d] are the effective reproduction number and the number of cases reported on day d, respectively. The parameters g and T denote the mean generation time and length of the reporting interval, respectively. The mean generation time is almost equal to the serial interval time, which Nishiura et al.40 estimated as 4.7 ± 2.9 days. The reporting time, T, was set to approximately 7 days because Pavlicek et al.41 reported that the number of new cases in Japan oscillates within a cycle of 7 days. In this study, we set g = 5 and T = 7 to obtain significant figures to one digit. Note that this calculation method was introduced by the National Institute of Infectious Diseases42 and is used in various reports on COVID-19 infection in Japan. The calculated values obtained in this study are approximate to those obtained by another method43; details are provided in the Supplementary Information.
Because the population influx data oscillate with a 7-day cycle (from Monday to Sunday), in the analysis, the population influx is averaged at the weekly scale. Therefore, the effective reproduction number is averaged at the same scale.
Decomposing population influx via factor analysis
In total, seven COVID-19 pandemics occurred intermittently throughout Japan by September 2022. Data concerning population influx and the effective reproduction number from the 3rd to 7th waves of the pandemic in the 23 wards of Tokyo are used in this study. These data are divided by each period of the COVID-19 pandemic in Japan, as shown in Fig. 5 and Table 2.
Fig. 5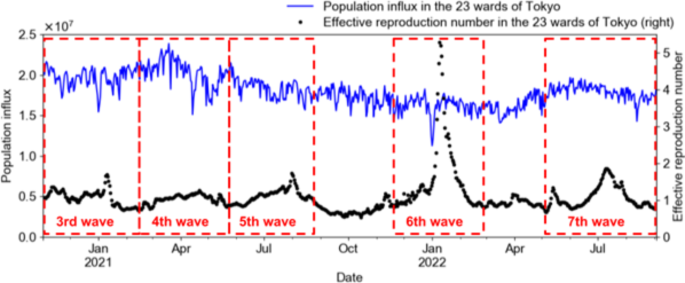
Population influx and effective reproduction number in the 23 regions of Tokyo from the 3rd wave to the 7th wave of the COVID-19 pandemic. Because the periods of the waves of the COVID-19 pandemic lack a clear boundary, the period boundaries are set in this study based on when the effective reproduction number is less than 1 before and after each peak.
Table 2 Each period of the COVID-19 pandemic in the 23 regions of Tokyo from the 3rd wave to the 7th wave.
The patterns of movement of individuals vary (for example, commuting to the office/school, shopping, and walking around in a neighbourhood); thus, multiple patterns of movement coexist within the same region. Because COVID-19 is transmitted through contact with infected people, common movement patterns related to opportunities for interaction with infected people among various visiting behaviours are assumed to underlie the spread of new COVID-19 cases. Therefore, we identify factors of population influx via factor analysis.
The following is a summary of the configurations of factor analysis. The principal factor method is selected for factor extraction. Varimax rotation is selected as the rotation method to calculate the factor loadings for each factor. The number of factors for effective hotspot determination is found to be 10 (therefore, the population influx is decomposed into 10 factors from Factors 1 to 10) as a result of searching. The index of the factors is assigned in descending order of the factor contribution rate among the common factors (in other words, in order of major influx patterns). The cumulative factor contribution rate explained by Factors 1 to 10 is at least 68% in each period. We implemented it in Python using a library called FactorAnalyzer.
Calculation of the sum of the product of the population influx and factor loadings
For each of the factors from 1 to 10, the sum of the product of the population influx and the factor loadings for each mesh in the entire area of the 23 wards of Tokyo, hereafter referred to as composite loading, is calculated.
$${Y}_{k}[d] = \sum_{i=1}^{M} {{a}_{ki}} {x}_{i}[d] ,$$
(2)
where \({Y}_{k}\) is the composite loading for factor k, \(d\) is the date of the 7-day cycle, \(M\) is the number of 500 m2 meshes in the 23 wards of Tokyo, \({a}_{ki}\) is the factor loading value for factor k in mesh i, and \({x}_{i}\) is the population influx in mesh i. \({Y}_{k}\), the composite loading for factor k, represents the strength of the k-th factor (influx pattern). Note that the total number of meshes in the 23 wards of Tokyo in this research is 2,426, and the meshes for which statistical values are obtained are counted (approximately 2,400 meshes in each period).
Hotspot estimation
To measure the relationship between the influx pattern and the spread of COVID-19 infection, the correlation coefficients of the composite loading and the effective reproduction number are calculated for Factors 1 to 10 in each period. Note that this coefficient is also calculated for all cases when the timing of the effective reproduction number is delayed by 1 to 4 weeks because COVID-19 spreads by infecting others over several stages.
The steps to estimate the hotspot are as follows:
1.
Determine the time lag of the effect on COVID-19 spread for each factor
2.
The factor with the highest absolute value of the correlation coefficient affects in a short term
3.
If the correlation coefficient in step 2 is positive (negative), the meshes with high positive (negative) factor loading are hotspot
The details are explained below.
First, we consider factors that have an effect on the spread of COVID-19 several weeks later on the basis of the weeks of delay with the strongest correlation. For example, if a factor has the strongest correlation with a 1-week delay, then the factor affects the spread of COVID-19 reported next week. If there is a factor of population movement to specific meshes where many people become infected, which are considered hotspots, the delay with the strongest correlation should be the sum of the incubation period, the number of days after symptoms appear to show a positive test and the number of days to report the infection. On the other hand, for a factor that affects COVID-19 spread in more indirect ways, i.e., a factor of population movement to areas where a small number of people trigger many subsequent infections (e.g., the first infected person in a family who triggers subsequent household infections), the delay with the strongest correlation should be the sum of the multiple generation time (4.7 ± 2.9 days40), the time taken to obtain a positive test and the time required to report the infection. Likewise, the delay with the strongest correlation is important information as well as the level of correlation.
Second, to find hotspots, the factors for which the delay with the strongest correlation is 1 or 2 weeks are subjected to further investigation. Because the incubation period for COVID-19 infection is estimated to be approximately 5 days32,33,34 and additional days are required before a positive test can be obtained and the infection can be reported, the expected delay with the strongest correlation for the factors associated with visits to hotspots is 1 week to 2 weeks. We select the factor with the highest absolute value of the correlation coefficient among the subject factors.
Finally, if the correlation coefficient of the composite loadings with the effective reproduction number for a given factor in the previous step is high and positive, when the influx pattern of the factor is high, i.e., more people move to the meshes with positive factor loading instead of those with negative factor loading for that factor, the effective reproduction number tends to increase. Therefore, the meshes with high factor loading values based on composite loading are presumed to be hotspots of COVID-19 infection. Similarly, visits to meshes with a negative and high absolute value of factor loading may reduce the effective reproduction number, and vice versa, if the correlation coefficient is negative. Therefore, meshes with negative and high absolute values of factor loading are presumed to be hotspots of COVID-19 infection when the correlation coefficient is negative.
In summary, the definitions of hotspots in this paper are as follows.
1.
If the correlation coefficient of the highest absolute value in the factors for which the maximum correlation coefficient is observed with assumptions of delays of 1 and 2 weeks is positive, the meshes with high and positive factor loadings for the factor with the highest correlation coefficient are considered hotspots.
2.
If the correlation coefficient of the highest absolute value in the factors for which the maximum correlation coefficient is observed with an assumption of a delay of 1 or 2 weeks is negative, the meshes with negative and high absolute values of factor loading for the factor with the correlation coefficient with the highest absolute value are hotspots.
We search for areas presumed to be hotspots in each period of the COVID-19 pandemic in the 23 wards of Tokyo.
AloJapan.com