

Comprehensive development level of cultural industry and tourism industry
Based on Fig. 4A, it can be observed that the cultural index of the 46 prefectures in Japan, excluding Tottori, showed an overall upward trend from 2009 to 2019. This indicates that during this eleven-year period, the level of development in Japan’s cultural industry has experienced a certain degree of improvement, with a relatively stable trend. The cultural index of most prefectures is concentrated between 0.1 and 0.3, suggesting that the cultural development level in most prefectures is relatively low and fairly consistent. However, the cultural indices of Tokyo and Osaka have consistently remained above 0.75, indicating a significant gap compared to most prefectures. Furthermore, over time, the gap in cultural indices between Tokyo and Osaka has gradually narrowed, with Osaka’s overall growth rate in cultural industry development surpassing that of Tokyo. Although the growth rate of the cultural industry in Tokyo is relatively slower compared to Osaka, the cultural index continues to approach 1, maintaining a relatively high level of development over the eleven-year period. Additionally, the gap in cultural indices between the remaining prefectures and Tokyo and Osaka is also gradually narrowing but still remains relatively large. In terms of the average development level, the average cultural index fluctuates between 0.201 and 0.332 annually over the eleven-year period, with a total average cultural index of 0.271. Overall, with the passage of time, the level of development in Japan’s cultural industry is continuously improving, but overall, the development level is uneven, characterized by a few high, a minority moderate, and the majority low situations.
Fig. 4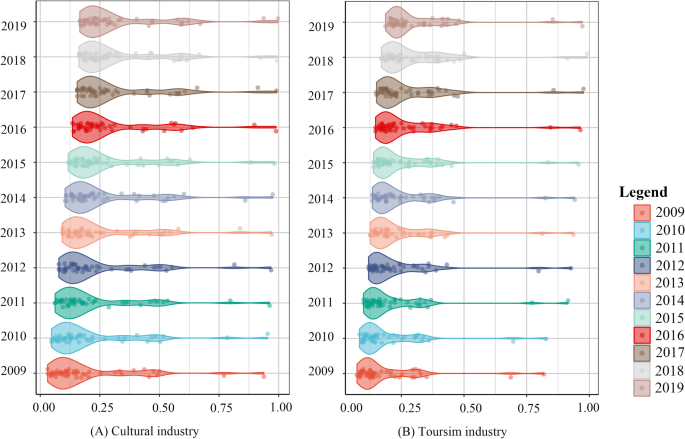
Comprehensive development level of CI and TI from 2009 to 2019.
According to Fig. 4B, the overall tourism index in Japan demonstrated an upward trend from 2009 to 2019, indicating a general enhancement in Japan’s tourism sector. Most prefectures exhibited tourism indices concentrated below 0.25, suggesting a relatively modest level of tourism development, which was consistent across these regions. Conversely, Tokyo and Osaka consistently maintained tourism indices above 0.6, distinguishing them as notable regions with a substantial margin compared to most prefectures.
Over the eleven-year period, most prefectures witnessed an overall upward trajectory in their tourism indices. However, Tokyo and Osaka experienced fluctuating trends. Notably, from 2009 to 2018, the tourism indices showed a progressive incline, with a notable surge observed between 2010 and 2011. Yet, from 2018 to 2019, a declining trend was noted, with moderate growth in other years. Nevertheless, the gap between Tokyo and Osaka’s tourism indices remained relatively stable. On average, annual tourism index varied between 0.185 and 0.307 during the course of eleven years, with an overall average tourism index of 0.25. This indicates that the general level of development in Japan’s tourist industry is moderate.
In summary, during the period from 2009 to 2019, both Japan’s cultural and tourism sectors experienced some advancements. Tokyo and Osaka showcased relatively high levels of development in both cultural and tourism domains, while most other regions demonstrated comparable yet relatively low levels of development. The cultural and tourism industry exhibited distinct levels of development, with most regions scoring poorly, indicating an overall imbalance in growth.
Analysis of coupling coordination degree between culture and tourism industry
In Fig. 5, In the Japan region, the coupling coordination degree between culture and tourism increased from 0.317 to 0.378, albeit with a little increase, and the coupling coordination degree between culture and tourism is generally slightly unbalanced. This indicates that Japan still has a long way to go in terms of coordinating culture and tourism. When analyzed spatially, the coupling coordination degree in Japan is substantially stronger in the region of the area traversed by the 35°N latitude line, with Tokyo and Osaka standing out. Conversely, areas near the 32nd and 39th parallel north latitude lines exhibit lower coupling coordination degree, implying a less synchronized link between the cultur and tourism industry.
Fig. 5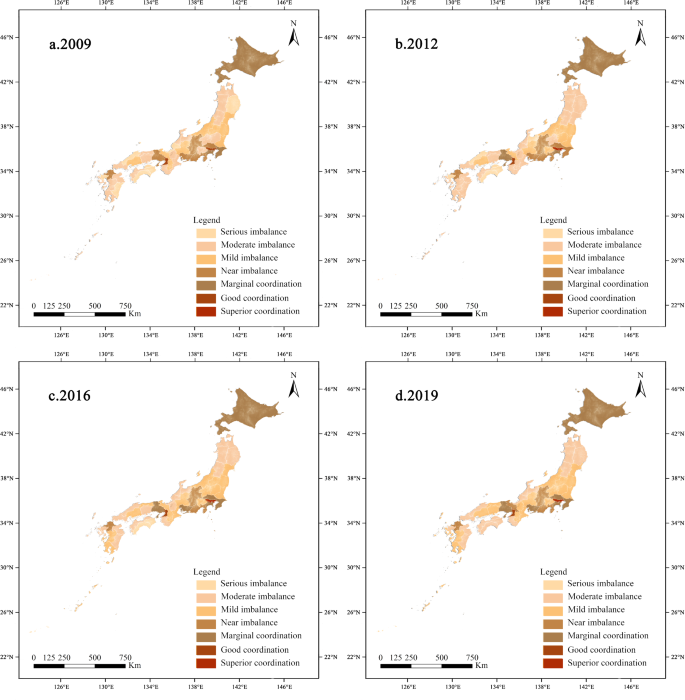
Spatiotemporal evolution of CI and TI coupling coordination degree.
Furthermore, the Kanto and Kinki regions, centered around Tokyo and Osaka respectively, demonstrate elevated levels of coupling coordination degree, reflecting their relatively advanced development in both cultural and tourism sectors. Similarly, Hokkaido, a popular tourist destination, has relatively high levels of coupling coordination between its culture and tourism industry. In contrast, the Chubu region presents a more moderate level of coupling coordination degree, with development oscillating between mild imbalance and marginal coordination. However, Japan’s Tohoku, Chugoku, Kyushu, and Shikoku regions are less coordinated in terms of regional coupling, and are in the range between serious imbalance and moderate imbalance. Overall, with the exception of Hokkaido, Japan’s cultural and tourism industry demonstrate a pattern of moderate-to-high coordination in central regions, while peripheral areas exhibit lower levels of coordination, highlighting significant regional disparities.
Analysed from the perspective of time, from 2009 to 2019, the degree of coordination between culture and tourism in Japan increased year after year. The level of coupling coordination between culture and tourism in Miyazaki, Iwate, Fukui, Yamanashi, and Tochigi has increased from 2009 to 2012, it is still at the level of imbalance. However, the coupling coordination degree between culture and tourism in Nara has transitioned from a moderate imbalance to a serious imbalance. From 2012 to 2016, the coupling coordination degree between culture and tourism in regions experienced a similar improvement such as Kumamoto, Kagoshima, Kagawa, and Nara, as well as Mie, Miyagi, and Nagano, from serious imbalance to moderate imbalance, and then from moderate imbalance to mild imbalance. Despite remaining in an imbalanced state, there is an overall positive trend observed during this period. From 2016 to 2019, the coupling coordination degree between culture and tourism in Tokushima has transitioned from a state of severe imbalance to a state of moderate imbalance. The coupling coordination degree in Okayama and Shiga has transitioned from a moderate imbalance to a mild imbalance. The level of coupling coordination in Kyoto has transitioned from a mild imbalance to a state of near imbalance. In contrast, the other prefectures remained relatively stable over the duration of the study. Generally speaking, over the course of 11 years, the overall coupling coordination degree in Japan has been steadily increasing. However, the rate of increase has been very sluggish and the magnitude of the increase has been quite modest. Among them, Tokyo and Osaka have consistently maintained a relatively high level of coupling coordination, especially Tokyo and Osaka, which have a high level of coupling coordination between culture and tourism. It should not be overlooked that there are still 19 prefectures that have not changed significantly over the eleven-year period.
Test of the coupling and coordination degree between cultural industry and tourism industryKernel density analysis
This research used Kernel Density Analysis in ArcGIS to determine the spatial distribution density of the coupling coordination degree between Japan’s culture and tourism industry in order to evaluate their development state, as shown in Fig. 6. The resulting map reveals distinct patterns: notably, in the Tokyo and Osaka regions, colors are deeper, indicating higher kernel density values, suggesting a more robust level of coordination between cultural and tourism sectors. Conversely, regions like Tohoku, Kyushu, and Shikoku exhibit lighter colors, signifying lower kernel density values and consequently poorer coordinated development between these industries. Over time, discernible changes in color depth are observed, particularly in the Kyushu region, where darker colors expand gradually. This indicates gradual enhancements in the synchronized advancement of the culture and tourism industry in Kyushu throughout time. Overall, the color distribution presents a distinct pattern: darker shades are concentrated in the middle, while lighter shades predominate on the sides. This indicate that there is a greater degree of coupling coordination development in core locations and a lower degree of coordination development in peripheral places. Notably, Tokyo and Osaka are particularly notable for their strong collaboration between the culture and tourism industry. Furthermore, as time progresses, areas transitioning from lighter to darker shades continue to increase, indicating an overall positive trend in the coupling coordination degree between culture and tourism industries. This suggests enhancing coordination and synergy between these sectors is yielding positive results, contributing to their overall development.
Fig. 6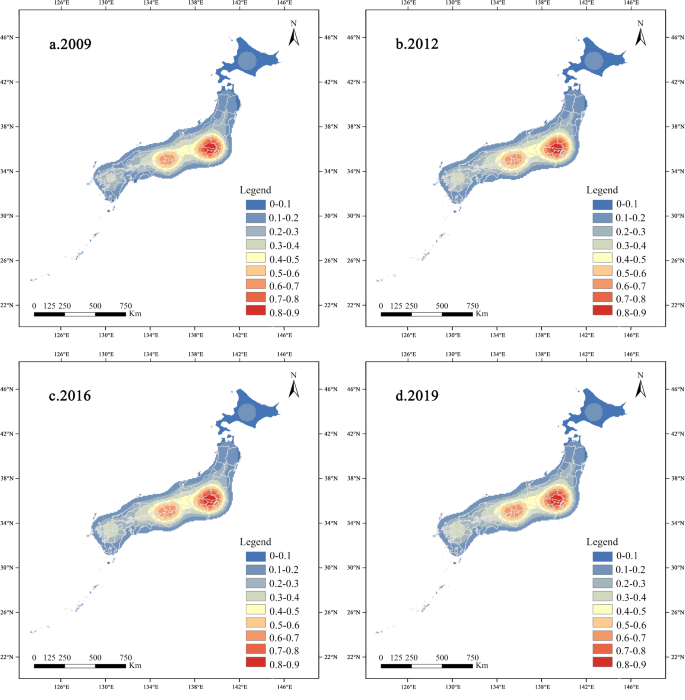
Spatiotemporal distribution of nuclear density of CI and TI coupling coordination degree.
Cluster difference analysis
Clustering and outlier analysis in ArcGIS are utilized to investigate the level of coupling coordination between the culture and tourism industry, as well as the interrelationship between different regions in Japan. According to the results in Fig. 7, Japan presents four main types of clustering, namely high – high clustering, high–low clustering, low–high clustering and low–low clustering. From 2009 to 2012, certain prefectures in the Chugoku region transitioned from being a cluster with high–low characteristics to a cluster with low-low characteristics. This indicates that the disparity between this particular area and its neighboring regions is gradually diminishing, and that the level of coordination and development between culture and tourism is similar. In the Kanto region, there is a transition from a densely concentrated area of high coupling coordination between culture and tourism to a sparsely concentrated area of high coupling coordination. This suggests that the development of coordination between culture and tourism in this region is progressing at a slower rate compared to the surrounding regions. From 2012 to 2016, certain prefectures in the Kanto region transitioned from having a low concentration of cultural and tourist development to having a high concentration. This suggests that the level of cooperation between culture and tourism in this area is steadily improving and becoming more comparable to adjacent regions. From 2016 to 2019, some prefectures in the Kyushu region and the Kanto region shifted to non-significant clustering. In addition, the Hokkaido region shifted from insignificant clustering to high – low clustering. This inferred that the degree of integration and synchronization between culture and tourism in the Hokkaido region has progressively risen over the years, creating a gap with the neighboring regions. Typically, there is a significant concentration of high-high clustering in the Kanto region, while the low-low clustering is primarily concentrated in the Chugoku, Kyushu, and Shikoku regions. The clustering results for the Tohoku and Chubu regions are not clearly evident. This indicates that areas with a high level of coupling coordination development between culture and tourism, while promoting their own coupling coordination development between culture and tourism, have a certain radiant effect on the surrounding areas, which is primarily concentrated in the Kanto region. Obviously, this demonstrates that the Kanto and Hokkaido areas have a high level of coupling coordination development between culture and tourism, whereas the Kyushu, Shikoku, and Chugoku regions have a low level of coupling coordination development between culture and tourism.
Fig. 7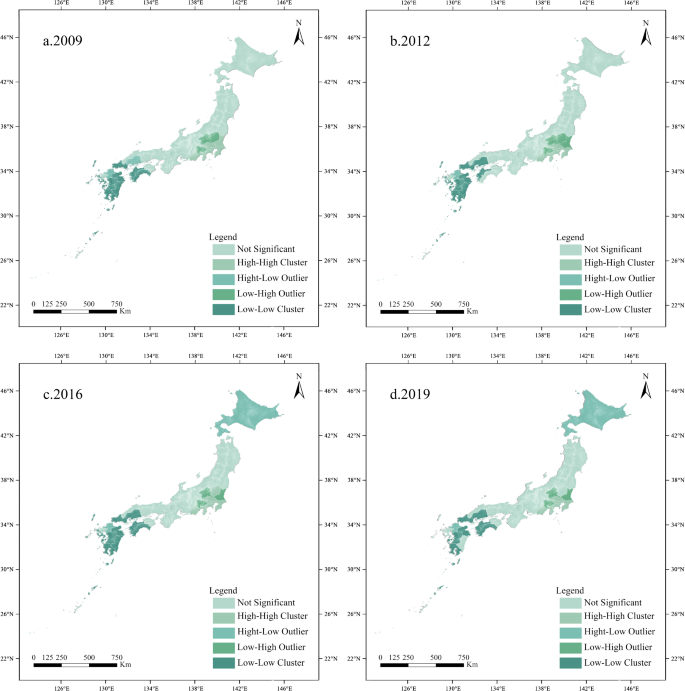
Cluster classification diagram based on the coupling coordination degree between CI and TI.
AloJapan.com