

Dataset
The dataset utilized in this study was obtained from the International Corpus of Japanese as a Second Language (I-JAS)Footnote 3. This corpus consisted of 1000 participants who represented 12 different first languages. For the study, the participants were given a story-writing task on a personal computer. They were required to write two stories based on the 4-panel illustrations titled “Picnic” and “The key” (see Appendix A). Background information for the participants was provided by the corpus, including their Japanese language proficiency levels assessed through two online tests: J-CAT and SPOT. These tests evaluated their reading, listening, vocabulary, and grammar abilities. The learners’ proficiency levels were categorized into six levels aligned with the Common European Framework of Reference for Languages (CEFR) and the Reference Framework for Japanese Language Education (RFJLE): A1, A2, B1, B2, C1, and C2. According to Lee et al. (2015), there is a high level of agreement (r = 0.86) between the J-CAT and SPOT assessments, indicating that the proficiency certifications provided by J-CAT are consistent with those of SPOT. However, it is important to note that the scores of J-CAT and SPOT do not have a one-to-one correspondence. In this study, the J-CAT scores were used as a benchmark to differentiate learners of different proficiency levels. A total of 1400 essays were utilized, representing the beginner (aligned with A1), A2, B1, B2, C1, and C2 levels based on the J-CAT scores. Table 1 provides information about the learners’ proficiency levels and their corresponding J-CAT and SPOT scores.
Table 1 Learners’ proficiency level and their J-CAT, SPOT scores.
A dataset comprising a total of 1400 essays from the story writing tasks was collected. Among these, 714 essays were utilized to evaluate the reliability of the LLM-based AES method, while the remaining 686 essays were designated as development data to assess the LLM-based AES’s capability to distinguish participants with varying proficiency levels. The GPT 4 API was used in this study. A detailed explanation of the prompt-assessment criteria is provided in Section Prompt. All essays were sent to the model for measurement and scoring.
Measures of writing proficiency for nonnative Japanese
Japanese exhibits a morphologically agglutinative structure where morphemes are attached to the word stem to convey grammatical functions such as tense, aspect, voice, and honorifics, e.g. (5).
(5)
食べ-させ-られ-まし-た-か
Japanese employs nine case particles to indicate grammatical functions: the nominative case particle が (ga), the accusative case particle を (o), the genitive case particle の (no), the dative case particle に (ni), the locative/instrumental case particle で (de), the ablative case particle から (kara), the directional case particle へ (e), and the comitative case particle と (to). The agglutinative nature of the language, combined with the case particle system, provides an efficient means of distinguishing between active and passive voice, either through morphemes or case particles, e.g. 食べる taberu “eatconcusive.” (active voice); 食べられる taberareru “eatconcusive.” (passive voice). In the active voice, “パンを食べる” (pan o taberu) translates to “to eat bread”. On the other hand, in the passive voice, it becomes “パンが食べられた” (pan ga taberareta), which means “(the) bread was eaten”. Additionally, it is important to note that different conjugations of the same lemma are considered as one type in order to ensure a comprehensive assessment of the language features. For example, e.g., 食べる taberu “eatconcusive.”; 食べている tabeteiru “eatprogress.”; 食べた tabeta “eatpast.” as one type.
To incorporate these features, previous research (Suzuki, 1999; Watanabe et al. 1988; Ishioka, 2001; Ishioka and Kameda, 2006; Hirao et al. 2020) has identified complexity, fluency, and accuracy as crucial factors for evaluating writing quality. These criteria are assessed through various aspects, including lexical richness (lexical density, diversity, and sophistication), syntactic complexity, and cohesion (Kyle et al. 2021; Mizumoto and Eguchi, 2023; Ure, 1971; Halliday, 1985; Barkaoui and Hadidi, 2020; Zenker and Kyle, 2021; Kim et al. 2018; Lu, 2017; Ortega, 2015). Therefore, this study proposes five scoring categories: lexical richness, syntactic complexity, cohesion, content elaboration, and grammatical accuracy. A total of 16 measures were employed to capture these categories. The calculation process and specific details of these measures can be found in Table 2.
Table 2 Measures of nonnative Japanese writing proficiency.
T-unit, first introduced by Hunt (1966), is a measure used for evaluating speech and composition. It serves as an indicator of syntactic development and represents the shortest units into which a piece of discourse can be divided without leaving any sentence fragments. In the context of Japanese language assessment, Sakoda and Hosoi (2020) utilized T-unit as the basic unit to assess the accuracy and complexity of Japanese learners’ speaking and storytelling. The calculation of T-units in Japanese follows the following principles:
(i)
A single main clause constitutes 1 T-unit, regardless of the presence or absence of dependent clauses, e.g. (6).
(6)
ケンとマリはピクニックに行きました (main clause): 1 T-unit.
(ii)
If a sentence contains a main clause along with subclauses, each subclause is considered part of the same T-unit, e.g. (7).
(7)
天気が良かったので (subclause)、ケンとマリはピクニックに行きました (main clause): 1 T-unit.
(iii)
In the case of coordinate clauses, where multiple clauses are connected, each coordinated clause is counted separately. Thus, a sentence with coordinate clauses may have 2 T-units or more, e.g. (8).
(8)
ケンは地図で場所を探して (coordinate clause)、マリはサンドイッチを作りました (coordinate clause): 2 T-units.
Lexical diversity refers to the range of words used within a text (Engber, 1995; Kyle et al. 2021) and is considered a useful measure of the breadth of vocabulary in Ln production (Jarvis, 2013a, 2013b).
The type/token ratio (TTR) is widely recognized as a straightforward measure for calculating lexical diversity and has been employed in numerous studies. These studies have demonstrated a strong correlation between TTR and other methods of measuring lexical diversity (e.g., Bentz et al. 2016; Čech and Miroslav, 2018; Çöltekin and Taraka, 2018). TTR is computed by considering both the number of unique words (types) and the total number of words (tokens) in a given text. Given that the length of learners’ writing texts can vary, this study employs the moving average type-token ratio (MATTR) to mitigate the influence of text length. MATTR is calculated using a 50-word moving window. Initially, a TTR is determined for words 1–50 in an essay, followed by words 2–51, 3–52, and so on until the end of the essay is reached (Díez-Ortega and Kyle, 2023). The final MATTR scores were obtained by averaging the TTR scores for all 50-word windows. The following formula was employed to derive MATTR:
(9)
\({\rm{MATTR}}({\rm{W}})=\frac{{\sum }_{{\rm{i}}=1}^{{\rm{N}}-{\rm{W}}+1}{{\rm{F}}}_{{\rm{i}}}}{{\rm{W}}({\rm{N}}-{\rm{W}}+1)}\)
Here, N refers to the number of tokens in the corpus. W is the randomly selected token size (W < N). \({F}_{i}\) is the number of types in each window. The \({\rm{MATTR}}({\rm{W}})\) is the mean of a series of type-token ratios (TTRs) based on the word form for all windows. It is expected that individuals with higher language proficiency will produce texts with greater lexical diversity, as indicated by higher MATTR scores.
Lexical density was captured by the ratio of the number of lexical words to the total number of words (Lu, 2012). Lexical sophistication refers to the utilization of advanced vocabulary, often evaluated through word frequency indices (Crossley et al. 2013; Haberman, 2008; Kyle and Crossley, 2015; Laufer and Nation, 1995; Lu, 2012; Read, 2000). In line of writing, lexical sophistication can be interpreted as vocabulary breadth, which entails the appropriate usage of vocabulary items across various lexicon-grammatical contexts and registers (Garner et al. 2019; Kim et al. 2018; Kyle et al. 2018). In Japanese specifically, words are considered lexically sophisticated if they are not included in the “Japanese Education Vocabulary List Ver 1.0”.Footnote 4Consequently, lexical sophistication was calculated by determining the number of sophisticated word types relative to the total number of words per essay. Furthermore, it has been suggested that, in Japanese writing, sentences should ideally have a length of no more than 40 to 50 characters, as this promotes readability. Therefore, the median and maximum sentence length can be considered as useful indices for assessment (Ishioka and Kameda, 2006).
Syntactic complexity was assessed based on several measures, including the mean length of clauses, verb phrases per T-unit, clauses per T-unit, dependent clauses per T-unit, complex nominals per clause, adverbial clauses per clause, coordinate phrases per clause, and mean dependency distance (MDD). The MDD reflects the distance between the governor and dependent positions in a sentence. A larger dependency distance indicates a higher cognitive load and greater complexity in syntactic processing (Liu, 2008; Liu et al. 2017). The MDD has been established as an efficient metric for measuring syntactic complexity (Jiang, Quyang, and Liu, 2019; Li and Yan, 2021). To calculate the MDD, the position numbers of the governor and dependent are subtracted, assuming that words in a sentence are assigned in a linear order, such as W1 … Wi … Wn. In any dependency relationship between words Wa and Wb, Wa is the governor and Wb is the dependent. The MDD of the entire sentence was obtained by taking the absolute value of governor – dependent:
(10)
MDD = \(\frac{1}{n}{\sum }_{i=1}^{n}|{\rm{D}}{{\rm{D}}}_{i}|\)
In this formula, \(n\) represents the number of words in the sentence, and \({DD}i\) is the dependency distance of the \({i}^{{th}}\) dependency relationship of a sentence. Building on this, the annotation of sentence ‘Mary-ga-John-ni-keshigomu-o-watashita was [Mary-top-John-dat-eraser-acc-give-past]’. The sentence’s MDD would be 2. Table 3 provides the CSV file as a prompt for GPT 4.
Table 3 CSV file for the MDD calculation.
Cohesion (semantic similarity) and content elaboration aim to capture the ideas presented in test taker’s essays. Cohesion was assessed using three measures: Synonym overlap/paragraph (topic), Synonym overlap/paragraph (keywords), and word2vec cosine similarity. Content elaboration and development were measured as the number of metadiscourse markers (type)/number of words. To capture content closely, this study proposed a novel-distance based representation, by encoding the cosine distance between the essay (by learner) and essay task’s (topic and keyword) i-vectors. The learner’s essay is decoded into a word sequence, and aligned to the essay task’ topic and keyword for log-likelihood measurement. The cosine distance reveals the content elaboration score in the leaners’ essay. The mathematical equation of cosine similarity between target-reference vectors is shown in (11), assuming there are i essays and (Li, …. Ln) and (Ni, …. Nn) are the vectors representing the learner and task’s topic and keyword respectively. The content elaboration distance between Li and Ni was calculated as follows:
(11)
\(\cos \left(\theta \right)=\frac{{\rm{L}}\,\cdot\, {\rm{N}}}{\left|{\rm{L}}\right|{\rm{|N|}}}=\frac{\mathop{\sum }\nolimits_{i=1}^{n}{L}_{i}{N}_{i}}{\sqrt{\mathop{\sum }\nolimits_{i=1}^{n}{L}_{i}^{2}}\sqrt{\mathop{\sum }\nolimits_{i=1}^{n}{N}_{i}^{2}}}\)
A high similarity value indicates a low difference between the two recognition outcomes, which in turn suggests a high level of proficiency in content elaboration.
To evaluate the effectiveness of the proposed measures in distinguishing different proficiency levels among nonnative Japanese speakers’ writing, we conducted a multi-faceted Rasch measurement analysis (Linacre, 1994). This approach applies measurement models to thoroughly analyze various factors that can influence test outcomes, including test takers’ proficiency, item difficulty, and rater severity, among others. The underlying principles and functionality of multi-faceted Rasch measurement are illustrated in (12).
(12)
\(\log \left(\frac{{P}_{{nijk}}}{{P}_{{nij}(k-1)}}\right)={B}_{n}-{D}_{i}-{C}_{j}-{F}_{k}\)
(12) defines the logarithmic transformation of the probability ratio (Pnijk/Pnij(k-1))) as a function of multiple parameters. Here, n represents the test taker, i denotes a writing proficiency measure, j corresponds to the human rater, and k represents the proficiency score. The parameter Bn signifies the proficiency level of test taker n (where n ranges from 1 to N). Dj represents the difficulty parameter of test item i (where i ranges from 1 to L), while Cj represents the severity of rater j (where j ranges from 1 to J). Additionally, Fk represents the step difficulty for a test taker to move from score ‘k-1’ to k. Pnijk refers to the probability of rater j assigning score k to test taker n for test item i. Pnij(k-1) represents the likelihood of test taker n being assigned score ‘k-1’ by rater j for test item i. Each facet within the test is treated as an independent parameter and estimated within the same reference framework. To evaluate the consistency of scores obtained through both human and computer analysis, we utilized the Infit mean-square statistic. This statistic is a chi-square measure divided by the degrees of freedom and is weighted with information. It demonstrates higher sensitivity to unexpected patterns in responses to items near a person’s proficiency level (Linacre, 2002). Fit statistics are assessed based on predefined thresholds for acceptable fit. For the Infit MNSQ, which has a mean of 1.00, different thresholds have been suggested. Some propose stricter thresholds ranging from 0.7 to 1.3 (Bond et al. 2021), while others suggest more lenient thresholds ranging from 0.5 to 1.5 (Eckes, 2009). In this study, we adopted the criterion of 0.70–1.30 for the Infit MNSQ.
Moving forward, we can now proceed to assess the effectiveness of the 16 proposed measures based on five criteria for accurately distinguishing various levels of writing proficiency among non-native Japanese speakers. To conduct this evaluation, we utilized the development dataset from the I-JAS corpus, as described in Section Dataset. Table 4 provides a measurement report that presents the performance details of the 14 metrics under consideration. The measure separation was found to be 4.02, indicating a clear differentiation among the measures. The reliability index for the measure separation was 0.891, suggesting consistency in the measurement. Similarly, the person separation reliability index was 0.802, indicating the accuracy of the assessment in distinguishing between individuals. All 16 measures demonstrated Infit mean squares within a reasonable range, ranging from 0.76 to 1.28. The Synonym overlap/paragraph (topic) measure exhibited a relatively high outfit mean square of 1.46, although the Infit mean square falls within an acceptable range. The standard error for the measures ranged from 0.13 to 0.28, indicating the precision of the estimates.
Table 4 Criteria measurement report.
Table 5 further illustrated the weights assigned to different linguistic measures for score prediction, with higher weights indicating stronger correlations between those measures and higher scores. Specifically, the following measures exhibited higher weights compared to others: moving average type token ratio per essay has a weight of 0.0391. Mean dependency distance had a weight of 0.0388. Mean length of clause, calculated by dividing the number of words by the number of clauses, had a weight of 0.0374. Complex nominals per T-unit, calculated by dividing the number of complex nominals by the number of T-units, had a weight of 0.0379. Coordinate phrases rate, calculated by dividing the number of coordinate phrases by the number of clauses, had a weight of 0.0325. Grammatical error rate, representing the number of errors per essay, had a weight of 0.0322.
Table 5 The weights of linguistic features in score prediction.Criteria (output indicator)
The criteria used to evaluate the writing ability in this study were based on CEFR, which follows a six-point scale ranging from A1 to C2. To assess the quality of Japanese writing, the scoring criteria from Table 6 were utilized. These criteria were derived from the IELTS writing standards and served as assessment guidelines and prompts for the written output.
Table 6 Criteria for evaluating nonnative Japanese writing quality.Prompt
A prompt is a question or detailed instruction that is provided to the model to obtain a proper response. After several pilot experiments, we decided to provide the measures (Section Measures of writing proficiency for nonnative Japanese) as the input prompt and use the criteria (Section Criteria (output indicator)) as the output indicator. Regarding the prompt language, considering that the LLM was tasked with rating Japanese essays, would prompt in Japanese works betterFootnote 5? We conducted experiments comparing the performance of GPT-4 using both English and Japanese prompts. Additionally, we utilized the Japanese local model OCLL with Japanese prompts. Multiple trials were conducted using the same sample. Regardless of the prompt language used, we consistently obtained the same grading results with GPT-4, which assigned a grade of B1 to the writing sample. This suggested that GPT-4 is reliable and capable of producing consistent ratings regardless of the prompt language. On the other hand, when we used Japanese prompts with the Japanese local model “OCLL”, we encountered inconsistent grading results. Out of 10 attempts with OCLL, only 6 yielded consistent grading results (B1), while the remaining 4 showed different outcomes, including A1 and B2 grades. These findings indicated that the language of the prompt was not the determining factor for reliable AES. Instead, the size of the training data and the model parameters played crucial roles in achieving consistent and reliable AES results for the language model.
The following is the utilized prompt, which details all measures and requires the LLM to score the essays using holistic and trait scores.
The prompt
Please evaluate Japanese essays written by Japanese learners and assign a score to each essay on a six-point scale, ranging from A1, A2, B1, B2, C1 to C2. Additionally, please provide trait scores and display the calculation process for each trait score. The scoring should be based on the following criteria:
Moving average type-token ratio.
Number of lexical words (token) divided by the total number of words per essay.
Number of sophisticated word types divided by the total number of words per essay.
Mean length of clause.
Verb phrases per T-unit.
Clauses per T-unit.
Dependent clauses per T-unit.
Complex nominals per clause.
Adverbial clauses per clause.
Coordinate phrases per clause.
Mean dependency distance.
Synonym overlap paragraph (topic and keywords).
Word2vec cosine similarity.
Connectives per essay.
Conjunctions per essay.
Number of metadiscourse markers (types) divided by the total number of words.
Number of errors per essay.
Japanese essay text
出かける前に二人が地図を見ている間に、サンドイッチを入れたバスケットに犬が入ってしまいました。それに気づかずに二人は楽しそうに出かけて行きました。やがて突然犬がバスケットから飛び出し、二人は驚きました。バスケットの中を見ると、食べ物はすべて犬に食べられていて、二人は困ってしまいました。(ID_JJJ01_SW1)
The score of the example above was B1. Figure 3 provides an example of holistic and trait scores provided by GPT-4 (with a prompt indicating all measures) via BingFootnote 6.
Fig. 3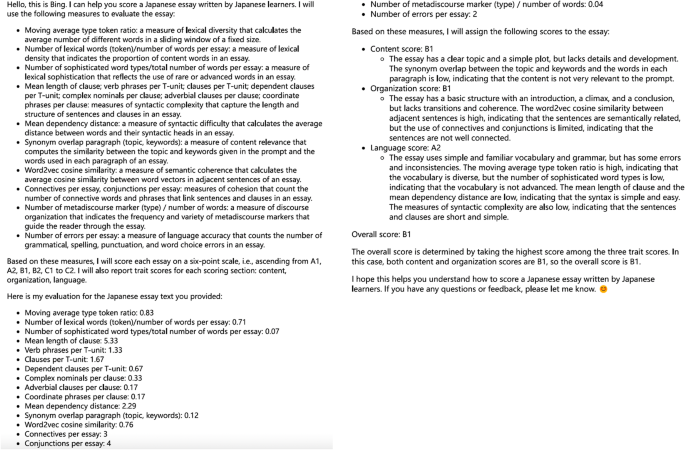
Example of GPT-4 AES and feedback (with a prompt indicating all measures).
Statistical analysis
The aim of this study is to investigate the potential use of LLM for nonnative Japanese AES. It seeks to compare the scoring outcomes obtained from feature-based AES tools, which rely on conventional machine learning technology (i.e. Jess, JWriter), with those generated by AI-driven AES tools utilizing deep learning technology (BERT, GPT, OCLL). To assess the reliability of a computer-assisted annotation tool, the study initially established human-human agreement as the benchmark measure. Subsequently, the performance of the LLM-based method was evaluated by comparing it to human-human agreement.
To assess annotation agreement, the study employed standard measures such as precision, recall, and F-score (Brants 2000; Lu 2010), along with the quadratically weighted kappa (QWK) to evaluate the consistency and agreement in the annotation process. Assume A and B represent human annotators. When comparing the annotations of the two annotators, the following results are obtained. The evaluation of precision, recall, and F-score metrics was illustrated in equations (13) to (15).
(13)
\({\rm{Recall}}(A,B)=\frac{{\rm{Number}}\,{\rm{of}}\,{\rm{identical}}\,{\rm{nodes}}\,{\rm{in}}\,A\,{\rm{and}}\,B}{{\rm{Number}}\,{\rm{of}}\,{\rm{nodes}}\,{\rm{in}}\,A}\)
(14)
\({\rm{Precision}}(A,\,B)=\frac{{\rm{Number}}\,{\rm{of}}\,{\rm{identical}}\,{\rm{nodes}}\,{\rm{in}}\,A\,{\rm{and}}\,B}{{\rm{Number}}\,{\rm{of}}\,{\rm{nodes}}\,{\rm{in}}\,B}\)
The F-score is the harmonic mean of recall and precision:
(15)
\({\rm{F}}-{\rm{score}}=\frac{2* ({\rm{Precision}}* {\rm{Recall}})}{{\rm{Precision}}+{\rm{Recall}}}\)
The highest possible value of an F-score is 1.0, indicating perfect precision and recall, and the lowest possible value is 0, if either precision or recall are zero.
In accordance with Taghipour and Ng (2016), the calculation of QWK involves two steps:
Step 1: Construct a weight matrix W as follows:
(16)
\({W}_{{ij}}=\frac{{(i-j)}^{2}}{{(N-1)}^{2}}\)
i represents the annotation made by the tool, while j represents the annotation made by a human rater. N denotes the total number of possible annotations. Matrix O is subsequently computed, where O_(i, j) represents the count of data annotated by the tool (i) and the human annotator (j). On the other hand, E refers to the expected count matrix, which undergoes normalization to ensure that the sum of elements in E matches the sum of elements in O.
Step 2: With matrices O and E, the QWK is obtained as follows:
(17)
K = 1- \(\frac{\sum i,j{W}_{i,j}\,{O}_{i,j}}{\sum i,j{W}_{i,j}\,{E}_{i,j}}\)
The value of the quadratic weighted kappa increases as the level of agreement improves. Further, to assess the accuracy of LLM scoring, the proportional reductive mean square error (PRMSE) was employed. The PRMSE approach takes into account the variability observed in human ratings to estimate the rater error, which is then subtracted from the variance of the human labels. This calculation provides an overall measure of agreement between the automated scores and true scores (Haberman et al. 2015; Loukina et al. 2020; Taghipour and Ng, 2016). The computation of PRMSE involves the following steps:
Step 1: Calculate the mean squared errors (MSEs) for the scoring outcomes of the computer-assisted tool (MSE tool) and the human scoring outcomes (MSE human).
Step 2: Determine the PRMSE by comparing the MSE of the computer-assisted tool (MSE tool) with the MSE from human raters (MSE human), using the following formula:
\({\rm{PRMSE}}=1-\frac{({\rm{MSE}}\,{\rm{tool}})\,}{({\rm{MSE}}\,{\rm{human}})\,}=1-\,\frac{{\sum }_{i}^{n}=1{({{\rm{y}}}_{i}-{\hat{{\rm{y}}}}_{{\rm{i}}})}^{2}}{{\sum }_{i}^{n}=1{({{\rm{y}}}_{i}-\hat{{\rm{y}}})}^{2}}\)
In the numerator, ŷi represents the scoring outcome predicted by a specific LLM-driven AES system for a given sample. The term yi − ŷi represents the difference between this predicted outcome and the mean value of all LLM-driven AES systems’ scoring outcomes. It quantifies the deviation of the specific LLM-driven AES system’s prediction from the average prediction of all LLM-driven AES systems. In the denominator, yi − ŷ represents the difference between the scoring outcome provided by a specific human rater for a given sample and the mean value of all human raters’ scoring outcomes. It measures the discrepancy between the specific human rater’s score and the average score given by all human raters. The PRMSE is then calculated by subtracting the ratio of the MSE tool to the MSE human from 1. PRMSE falls within the range of 0 to 1, with larger values indicating reduced errors in LLM’s scoring compared to those of human raters. In other words, a higher PRMSE implies that LLM’s scoring demonstrates greater accuracy in predicting the true scores (Loukina et al. 2020). The interpretation of kappa values, ranging from 0 to 1, is based on the work of Landis and Koch (1977). Specifically, the following categories are assigned to different ranges of kappa values: −1 indicates complete inconsistency, 0 indicates random agreement, 0.0 ~ 0.20 indicates extremely low level of agreement (slight), 0.21 ~ 0.40 indicates moderate level of agreement (fair), 0.41 ~ 0.60 indicates medium level of agreement (moderate), 0.61 ~ 0.80 indicates high level of agreement (substantial), 0.81 ~ 1 indicates almost perfect level of agreement. All statistical analyses were executed using Python script.
AloJapan.com